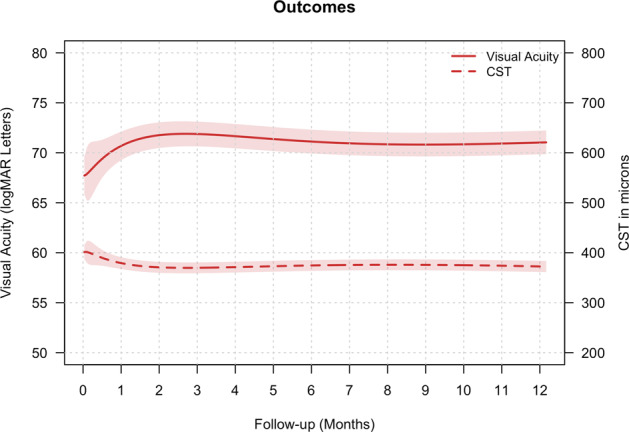
Fig. 1. Line graph depicting mean visual acuity (solid red line) in logMAR letters (y-axis) and central subfield thickness (CST, red dashed line) in microns (z-axis) for all 298 eyes entered in the study.

The red shaded area represents the 95% confidence interval.
