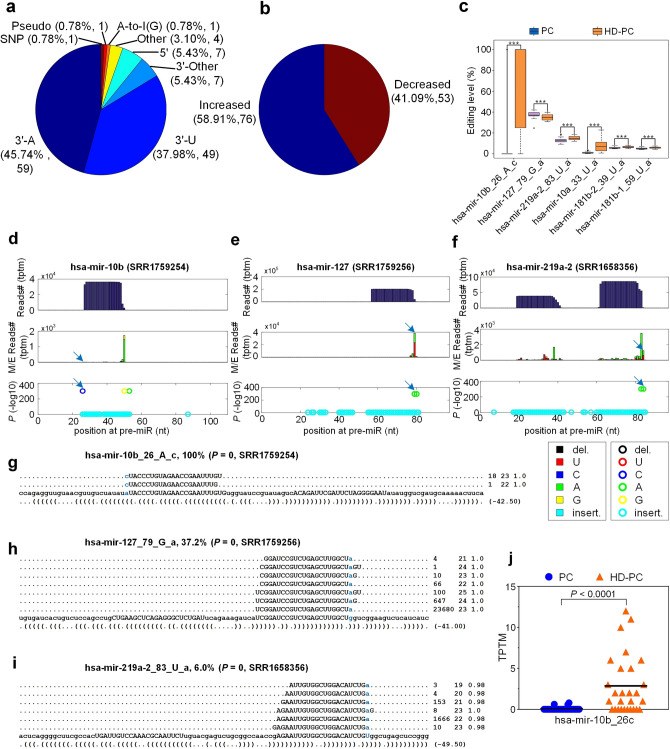
Figure 5.
The 129 miRNA M/E sites that have significantly different editing levels in HD-PC samples when compared to healthy controls. (a) The categories of the 129 M/E sites. (b) The change of editing levels of 129 M/E sites in HD-PC samples compared to PC samples. (c) Then editing levels of six miRNA M/E sites that have significantly different editing levels in HD-PC samples when compared to PC samples. “***” indicate P-values smaller than 0.05, Mann-Whitney U-tests and corrected with the Benjamini and Hochberg method85. (d) The MiRME map of hsa-mir-10b in one of the HD-PC samples (SRR1759254). (e) The MiRME map of hsa-mir-127 in one of the HD-PC samples (SRR1759256). (f) The MiRME map of hsa-mir-219a-2 in one of the Unknown samples (SRR1658356). (g-i) The details of hsa-mir-10b_26_A_c in SSR1759254, hsa-mir-127_79_G_a in SSR1759256 and hsa-mir-219a-2_83_U_a in SSR1658356, respectively. The edited nucleotide are shown in blue. And the first number on the right indicates the number of raw sequencing reads, the second number indicates the length of the reads, and the third number indicates the weight of the reads on this locus as calculated by the cross-mapping correction algorithm84. (j) Comparisons of normalized expression levels (in TPTM) of hsa-mir-10b_26c, i.e., hsa-mir-10b-5p with additional cytosine at 5’ end, in the HD-PC and PC samples.

