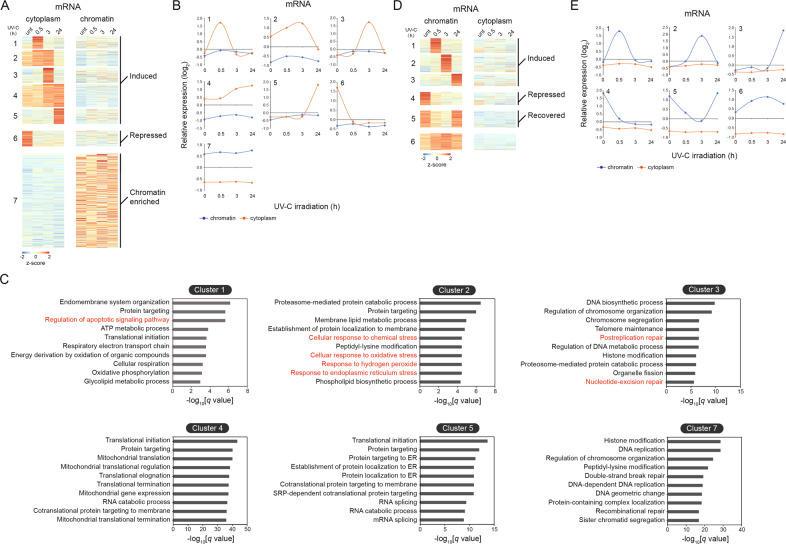
Fig. 3. Dynamic transcriptional programs of mRNAs in response to UV-C irradiation.
A Heat-map diagram showing the seven clusters of differentially expressed transcripts in the cytoplasm fraction following UV exposure. Color key represents relative expression on a log 2 scale. B The average relative transcript levels within each cluster presented in Fig. 3A are shown, with the log2 expression values on the y axis and time on the x axis. C Top 10 gene ontology enrichments of genes in clusters 2–5 and 7 with Bonferroni-corrected P values. D Heat-map diagram showing the six clusters of differentially expressed transcripts in the chromatin extract following UV exposure. Color key represents relative expression on a log 2 scale. E The average relative transcript levels within each cluster presented in Fig. 3D are shown, with the log2 expression values on the y axis and time on the x axis.

