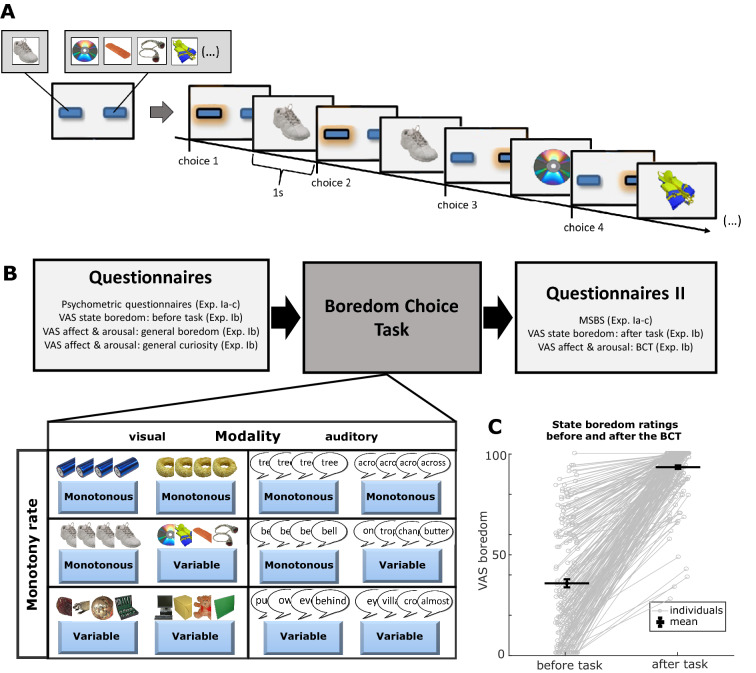
Figure 1.
Concept of the Boredom Choice Task: (A) Trial structure of the paradigm and example sequence of choices and stimulus presentations in the monotonous vs. variable condition, where the monotonous alternative in this example is located left. The shaded buttons represent the currently chosen options. (B) Schematic of the procedure, illustrating six basic task conditions (monotonous vs. variable, monotonous vs. monotonous, variable vs. variable in visual and auditory modality). Images are examples from the visual stimulus libraries taken from the Bank of Standardized Stimuli59,60. The structure of the experiments involved the BCT and various self-report questionnaires to assess boredom (BPS, MSBS, VAS-B), personality traits and symptoms of mental disorders (GHQ-28, CAARS-S:L, BDI-II, BFI-10, I-8, STAI-Y, BRS) as well as affect and arousal for imagined states of boredom, curiosity and the BCT (VAS-AA). (C) Visual analog state boredom ratings (VAS-B) before starting and after completing the Boredom Choice Task. Connected grey circles reflect the ratings of each individual (n = 201 participants). The horizontal bars reflect the average over all subjects and the vertical bars indicate the standard error of the mean. The boredom ratings after the task are significantly higher compared to the prior condition (p < 0.001 in a Wilcoxon signed rank test).

