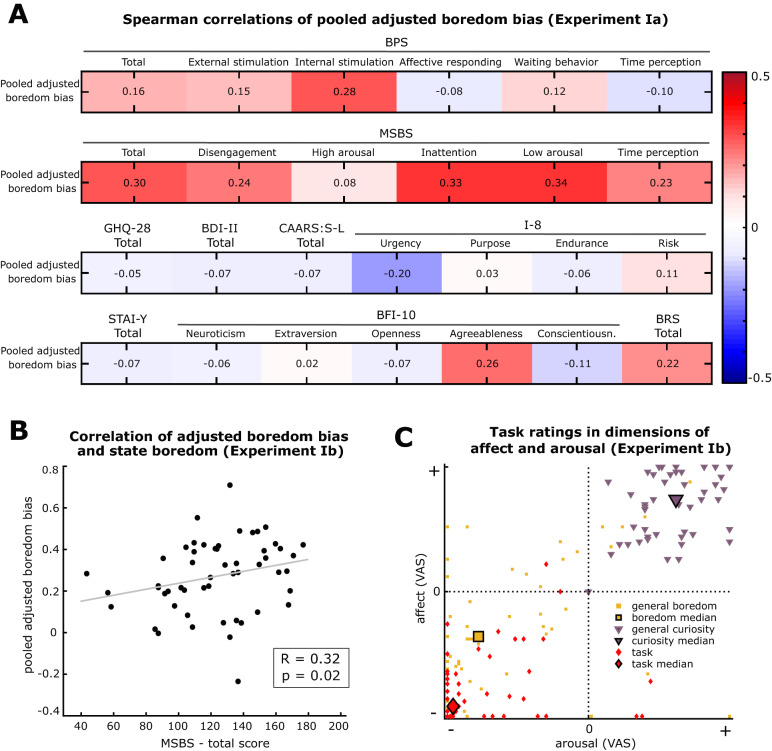
Figure 3.
Construct validation of the Boredom Choice Task: (A) Exploratory investigation of the Spearman correlations between the pooled adjusted boredom bias and the diverse psychometric self-reports (BPS Boredom Proneness Scale, MSBS Multidimensional State Boredom Scale, GHQ-28 General Health Questionnaire, BDI-II Beck’s Depression Inventory, CAARS:S-L Conner’s Adult ADHD Rating Scale, I-8 Impulsivity Questionnaire, STAI-Y State Trait Anxiety Inventory, BFI-10 Big Five Inventory, BRS Brief Resilience Scale). Each correlation is computed over n = 49 participants from Experiment Ia. The color of each cell displays the magnitude of correlation (R-value). (B) Specific correlation analysis with the independent data from Experiment Ib: The scatter plot illustrates the relationship between the pooled adjusted boredom bias of each participant and the corresponding MSBS state boredom report (n = 53 participants; Spearman’s R = 0.32, p = 0.02). The grey line indicates the best linear fit. (C) Scatter plot of participants’ visual analog scale (VAS) ratings of affect and arousal for imagined boredom (yellow), imagined curiosity (violet) and the BCT experience (red) (n = 53 participants from Experiment Ib). The large markers indicate the overall median of each condition.

