
Fig. 1. Assessment of the electrical perceptual threshold.
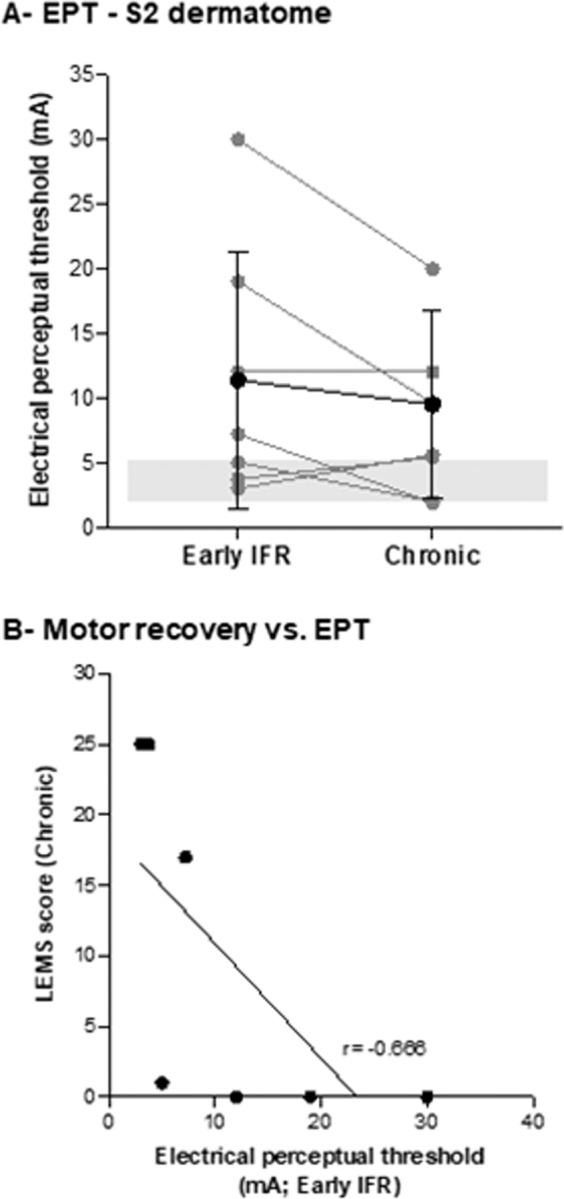
A Electrical perceptual thresholds (EPT) of right and left S2 dermatomes at the early IFR and chronic assessment time points. Grey points correspond to SCI participants. The lines indicate values from the same participant at both time points. Black points correspond to the mean of SCI participants ± SD. The grey shaded rectangle shows data from control participants. B Correlation between motor recovery (LEMS at the chronic stage) and EPT assessed at early IFR.