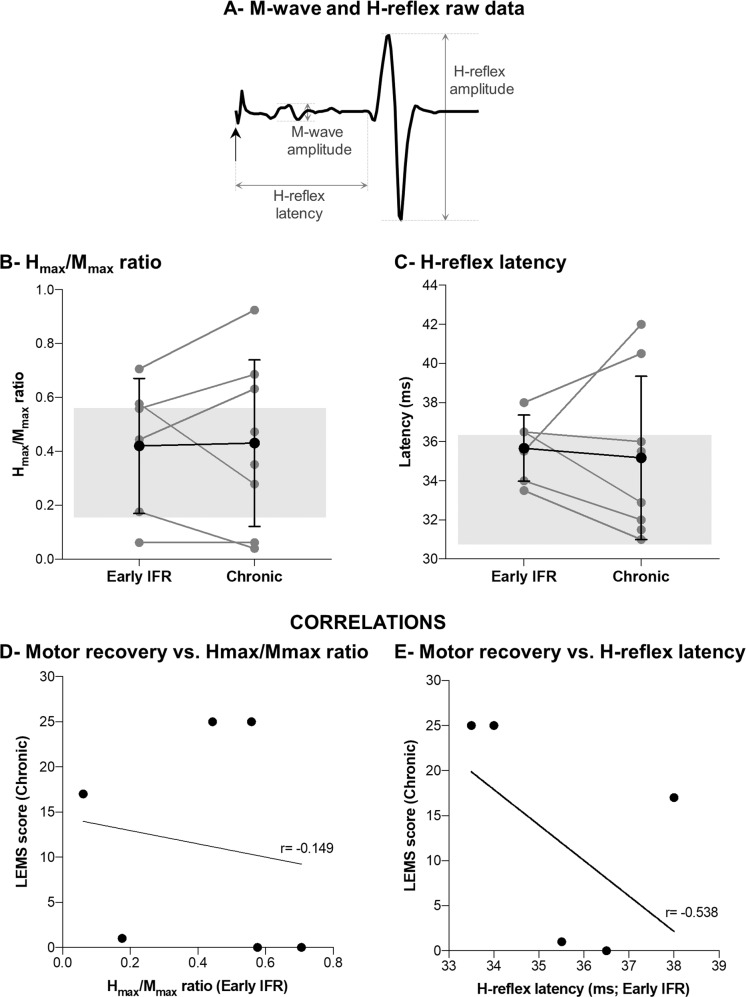
Fig. 2. Assessment of the Soleus H-Reflex.
A Typical M-wave and H-wave on a control participant’s SOL EMG induced by tibial nerve stimulation. B, C The light grey dots and lines represent individual SCI participants, and the black dots and error bars represent the mean of SCI participants. The shaded grey rectangle encompasses the mean ± SD of control participants. D, E Lack of correlation between motor recovery and H/M ratio (D) or Hmax latency (E) assessed at early IFR.

