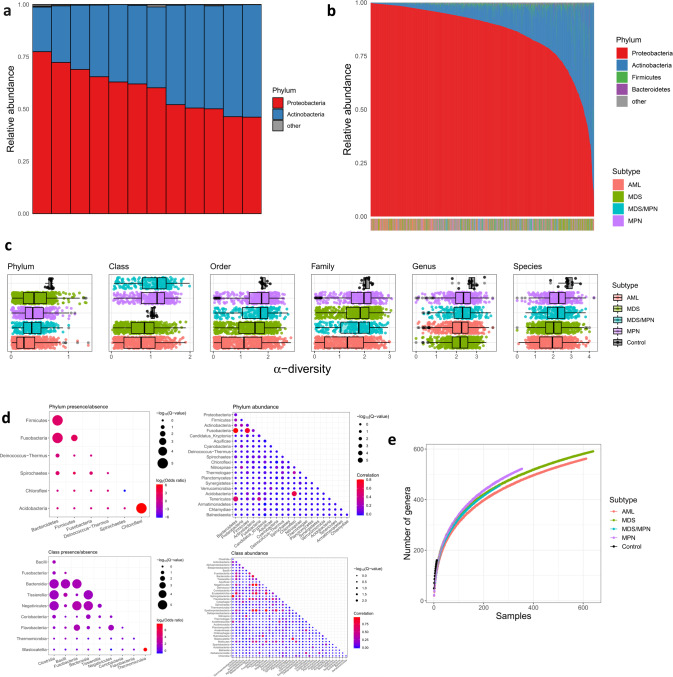
Fig. 3. The bacterial landscape in the bone marrow/blood of myeloid malignancy patients and controls.
a Relative abundances of phyla are represented by a colored bar for each of the 12 control bone marrow samples. b The 1870 colored bars, one for each patient, are ordered left to right by decreasing Proteobacteria relative abundance. The disease subtype of each patient is indicated in the horizontal color bar at the bottom (the enrichment of AML patients among the Proteobacteria-dominant samples is apparent by the color shift at the left side of the bar). c α-diversity of each sample within each taxonomic level, stratified by case/control status and disease subtype. Boxplots are ordered top to bottom in decreasing median α-diversity, with sample sizes 12, 612, 640, 264, and 354 for controls, AML, MDS, MDS/MPN, and MPN, respectively. In boxplots, bounds of box indicate first and third quartiles, center line indicates median, and whiskers extend to (first quartile −1.5 × IQR) and (third quartile +1.5 × IQR) or extrema, whichever is less extreme (here IQR = interquartile range, i.e. third quartile–first quartile). d Plot showing pairwise concordance/discordance of taxa, at the phylum (top) and class (bottom) levels, both with regard to presence/absence (left) and abundance (right). Sizes of the circles indicate statistical significance, and color indicates strength and direction of association (odds ratio or Pearson correlation). Only taxa with significant (Q < 0.1) concordance/discordance with at least one other taxon are shown. e Rarefaction plot showing number of genera as a function of number of patients, stratified by disease subtype. For each patient number n, a random sample of n patients was drawn from each subtype, 500 times. Solid curves represent the mean across the 500 replicates. For control samples, sampling is performed exhaustively (that is, all possible subsets of n individuals are selected for each n = 1,2,…,12).

