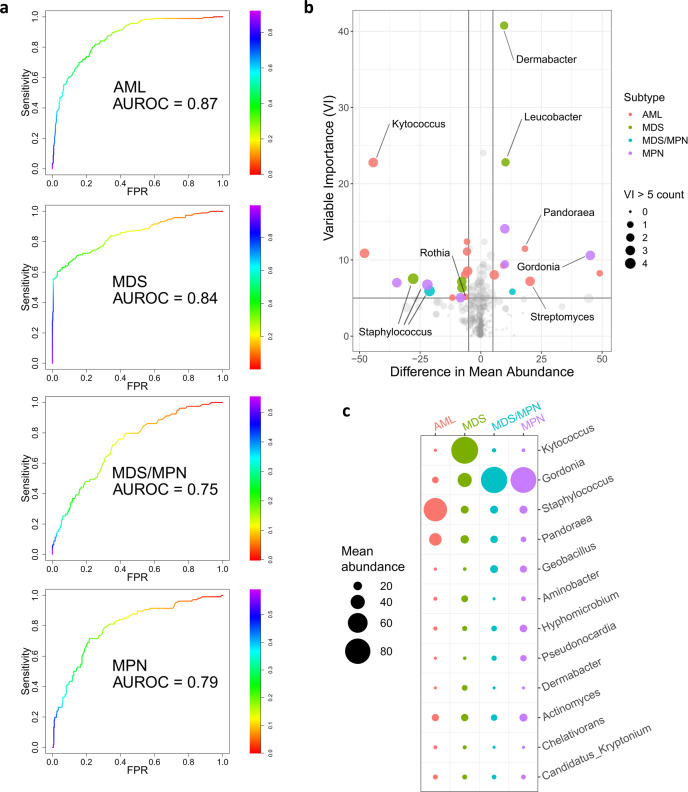
Fig. 4. Bacterial composition differs among disease subtypes.
a ROC curves showing, for each disease subtype, the performance on the test set (randomly selected 30% of samples) of binary random forest classifier trained on the training set (remaining 70%). The AUROC values shown are averaged across 1000 random 70%/30% splits. The random forest generates a probability of a sample having the disease subtype in question. The color bar indicates varying thresholds of this probability. b Volcano plot showing enrichment/depletion of bacterial genera in specific disease subtypes. Here horizontal axis indicates differences in mean abundance (subtype of interest—all others), and variable importance is shown on the vertical axis. Point size indicates number of subtypes (0 = smallest, 4 = largest) for which the corresponding genus has variable importance >5. Points with mean abundance difference >5 and variable importance >5 are colored by corresponding subtype. Points of interest are labeled with their corresponding genera. (VI variable importance). c Mean abundances, in each subtype, of the genera that are among the top five in variable importance for at least one of the subtypes. Circle size indicates the average abundance in the corresponding subtype. AUROC area under receiver operating characteristic curve; FPR false positive rate.

