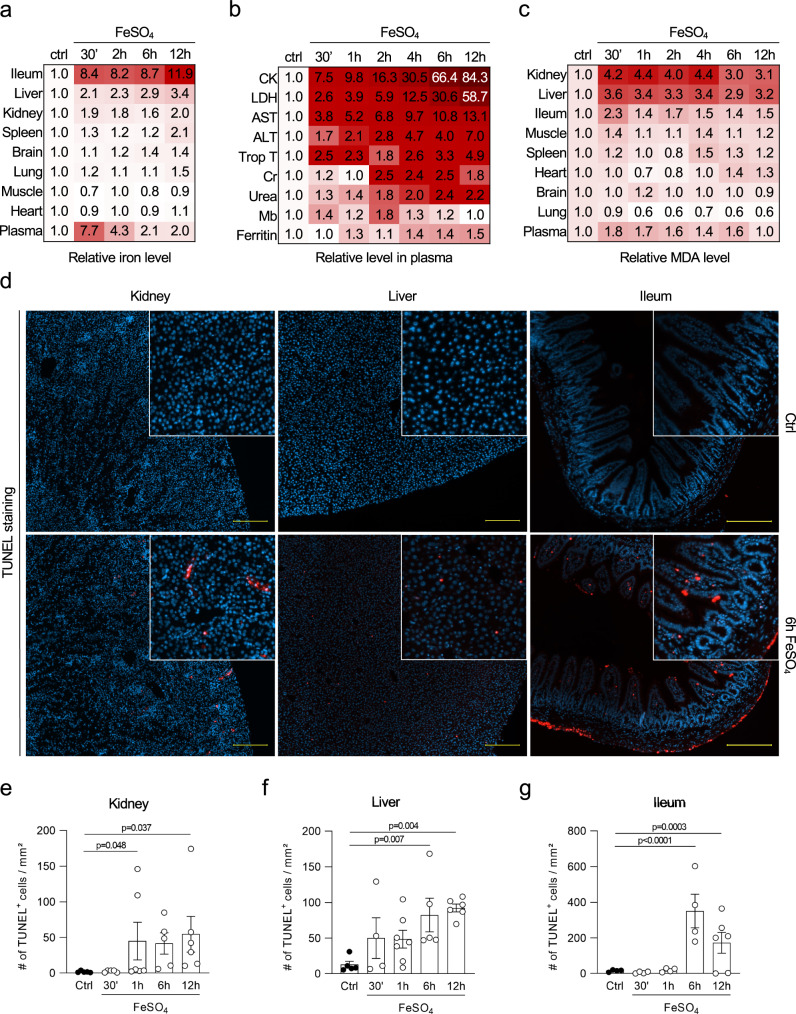
Fig. 2. Acute iron overload in mice causes multiorgan failure due to excessive lipid peroxidation.
a Heatmap representing the relative iron levels in various organs after acute iron overload as a function of time. The combined results of three independent experiments are shown (total n = 5–6/timepoint). b Heatmap representing the relative increase in creatine kinase (CK), lactate dehydrogenase (LDH), aspartate aminotransferase (AST), alanine aminotransferase (ALT), troponin T (Trop T), creatinine (Cr), urea, myoglobin (Mb), and ferritin after acute iron overload as a function of time in plasma. The combined results of minimum three independent experiments are shown (n = 6–13/time point). c Heatmap representing the relative MDA levels after acute iron overload as a function of time. The combined results of three independent experiments are shown (total n = 5–8/time point). d Immunohistochemical staining for cell death (TUNEL) in kidney, liver, and ileum 6 h after acute iron overload. Fluorescent photomicrographs representative for the outcome of three independent experiments (total n/time point described in panel e) are shown. Scale bar represents 200 µm. e–g Quantification of immunohistochemical staining for TUNEL in kidney (total n/condition from left to right is as follows: n = 5, 5, 6, 5, 6), liver (total n/condition from left to right is as follows: n = 5, 4, 7, 5, 6) and ileum (total n/condition from left to right is as follows: n = 4, 4, 4, 4, 6) sections after acute iron overload in function of time. The combined results of three independent experiments are shown. Heatmaps (a–c) show relative increase as color in two dimensions ranging from white (minimum) to red (maximum). Data were analyzed using one-way ANOVA followed by pairwise T-testing after fitting of a log-linear regression model (e–g). Means and SEM are represented. Source data are provided as a Source Data file.

