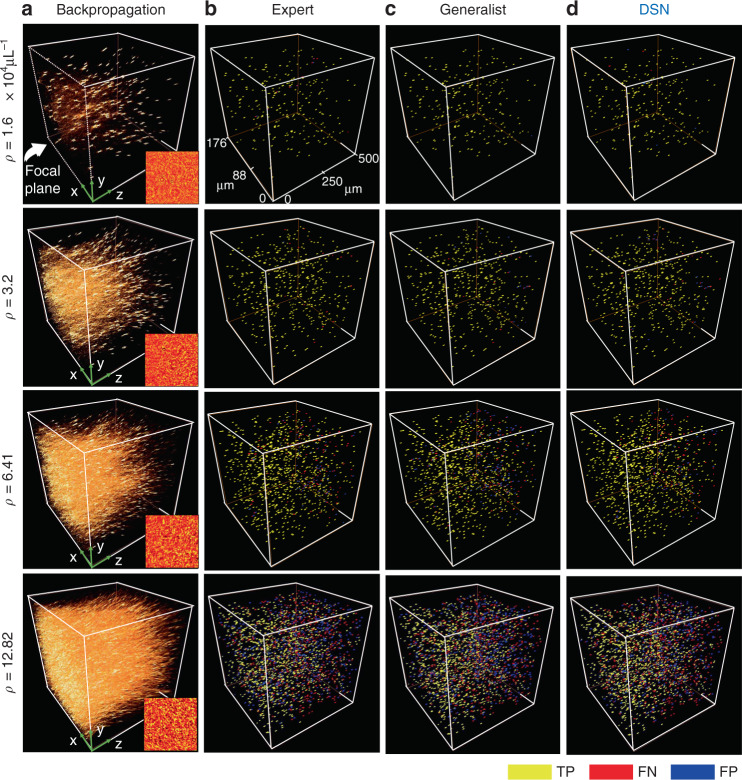
Fig. 2. Particle localization visualization.
a 3D renderings of the backpropagated volumes demonstrate the scattering artifacts for various particle densities. The corresponding hologram is shown as the insets. b–d Particle 3D localization results are shown for the expert, generalist and DSN, respectively. For low particle densities, all three DNNs perform similarly. As the particle density increases, the DSN provides improved performance, measured by the true positives (TP, in yellow), false negatives (FN, in red), and false positives (FP, in blue). The numbers of TP, FP, and FN are quantified in Table S1, highlighting that the results from the DSN contain much fewer FPs at high particle density cases

