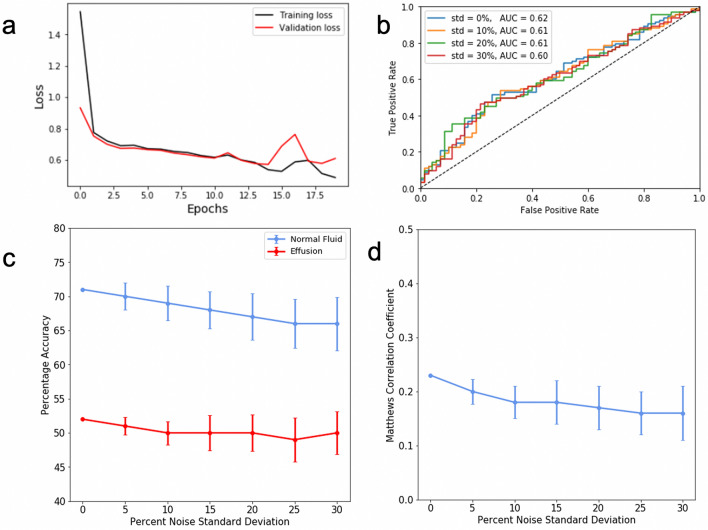
Figure 4.
(a) Learning curves for the training and validation data sets of the dNN. (b) The testing data was degraded with additive Gaussian noise with a standard deviation varying from 0 to 30% of the maximum pixel intensity. ROC curves were recorded, and the AUC was calculated. (c) The same method as panel b, mean and standard deviation of accuracy was recorded for each class. (d) The same noise addition method as panel b, mean and standard deviation of Matthews correlation coefficient was recorded with additive noise.

