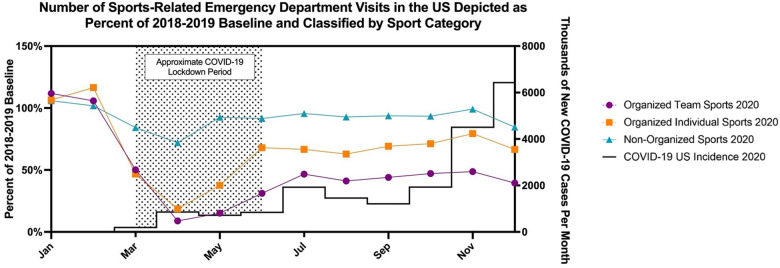
Figure 2.
Monthly incidence of positive COVID-19 tests in 2020 (black line) with the estimated monthly number of sports-related emergency department visits in the United States in 2020 expressed as a percentage of the 2018 and 2019 baseline for organized team sports (purple line), organized individual sports (orange line), and nonorganized sports (cyan line). The shaded area represents the 2020 COVID lockdown period.

