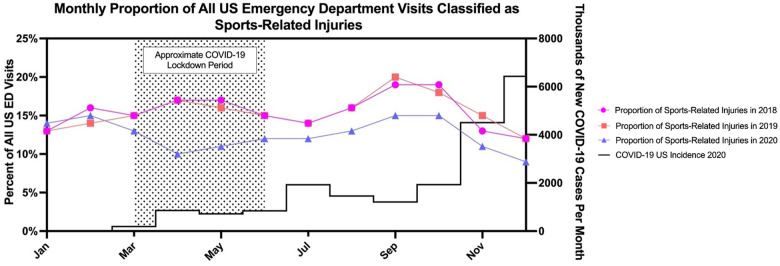
Figure 3.
Monthly incidence of positive COVID-19 tests in 2020 (black line) with the estimated monthly number of sports-related emergency department (ED) visits in the United States expressed as a percentage of all US ED visits in 2018 (pink line), 2019 (orange line), and 2020 (purple line). The shaded area represents the 2020 COVID lockdown period.

