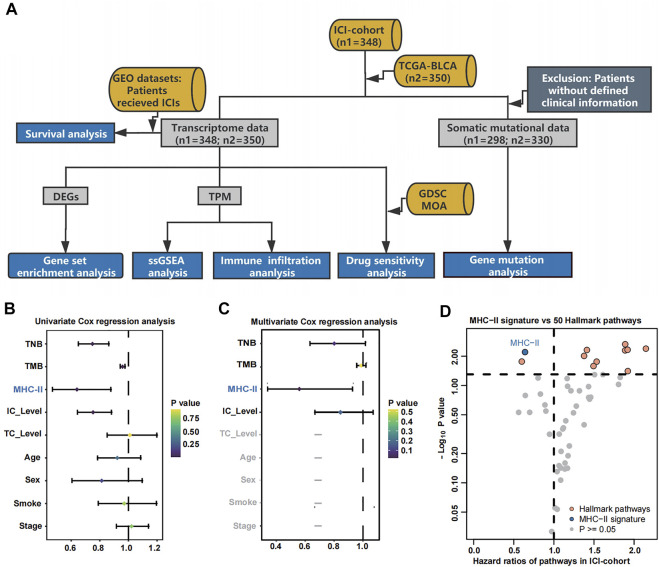
FIGURE 1.
Cox proportional hazards regression analysis results for the ICI-cohort and flowchart. (A). Flowchart. We quantified MHC-II signature by using the ssGSEA method to calculate the MHC-II signature score, then divided the patients into MHC-H and MHC-L groups within the ICI-cohort (n = 348) and the TCGA-BLCA cohort (n = 350). Based on these categories, patients with different MHC-II signature levels were comprehensively analyzed and classified by their immunome, transcriptome, metabolome, genome and drugome data. We also collected the transcription and survival data of two GEO cohorts treated with immunotherapy to verify the predictive value of the MHC-II signature. MHC-H: MHC-II signature score high; MHC-L: MHC-II signature score low. (B) The forest plot displays the results of a univariate analysis. Variables with a Cox P value less than 0.05 are MHC-II, TMB, TNB and IC Level. MHC-II: MHC-II signature score. The signature scores of the gene sets were calculated using the ssGSEA algorithm. (C) The forest plot displays the results of a multivariate analysis. Only MHC-II signature was an independent and favorable predictor of bladder cancer patients treated with ICIs (P < 0.05). (D) The volcano plot displays the results of a univariate analysis between MHC-II signature score (blue) and 50 hallmark pathways scores (orange and gray). Gray dots indicate pathways with a Cox P value less than 0.05. The hazard ratio [HR] indicates protective (HR < 1) or risk (HR > 1) factors. The horizontal dashed line indicates p = 0.05. The gene sets of 50 hallmark pathways were obtained from the MSigDB. Orange dots from left to right indicate the following pathways: spermatogenesis, angiogenesis, coagulation, UV response DN, xenobiotic metabolism, TGFβ signaling, hypoxia, wntβ catenin signaling, reactive oxygen species pathway and p53 pathway.

