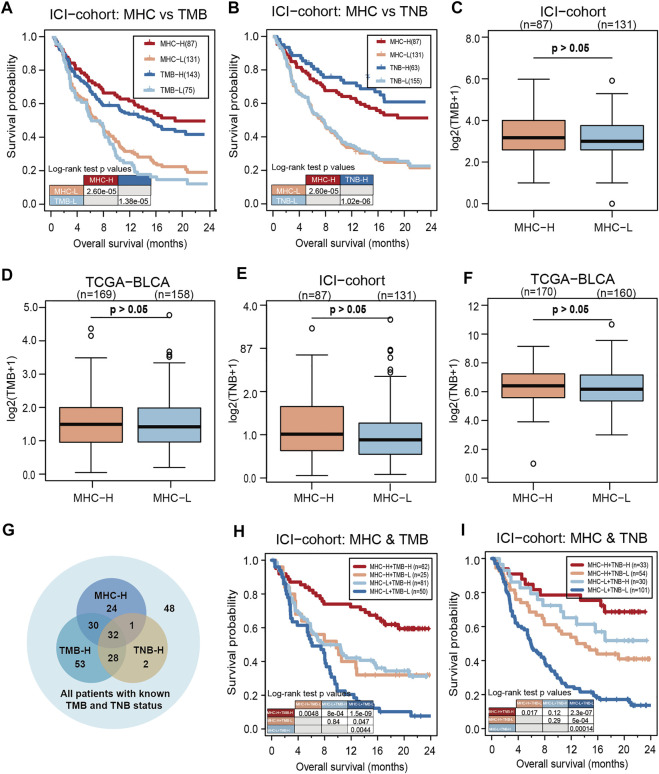
FIGURE 3.
MHC-II signature is superior to TMB and slightly inferior to TNB as predictive biomarkers. (A) KM analysis showed that MHC-II signature was superior to TMB in the ICI-cohort (MHC-II signature: HR = 0.47, 95% CI: 0.34–0.65, P = 2.60e-05; TMB: HR = 0.49, 95% CI: 0.34–0.70, P = 1.38e-05). (B) KM analysis showed that MHC-II signature was slightly inferior to TNB in the ICI-cohort (MHC-II signature: HR = 0.47, 95% CI: 0.34–0.65, P = 2.60e-05; TNB: HR = 0.35, 95% CI: 0.25–0.49, P = 1.02e-06). (C,D) Boxplots show that there was no significant relationship between MHC-II signature and TMB in either the ICI-cohort (C) or the TCGA-BLCA cohort (D) (Wilcoxon Test, all P > 0.05). E-F. Boxplots showed that there was no significant relationship between MHC-II signature and TNB in either the ICI-cohort (E) or the TCGA-BLCA cohort (F) (wilcoxon test, all P > 0.05). (G) Venn diagram showed the distribution in the MHC-H and MHC-L groups of patients with known TMB and TNB status in the ICI-cohort (n = 218). (H) KM curves show the comparison of MHC-H + TMB-H, MHC-H + TMB-L, MHC-L + TMB-H and MHC-L + TMB-L in ICI-cohort (n = 218). (I) KM curves show the comparison of MHC-H + TNB-H, MHC-H + TNB-L, MHC-L + TNB-H and MHC-L + TNB-L in the ICI-cohort (n = 218).

