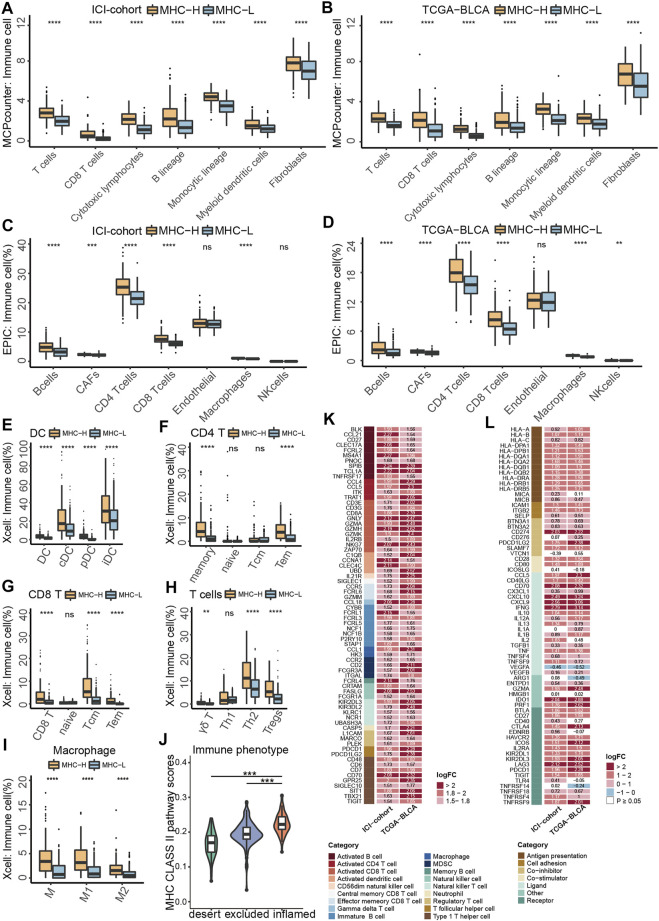
FIGURE 4.
MHC-II signature shows correlation with immune cell infiltration and anti-tumor immunity. (A,B) MCP-counter analyses quantifying immune cells and stromal cells in MHC-H and MHC-L groups in ICI-cohort (A) and TCGA-BLCA cohort (B) (C,D) EPIC analyses quantifying the infiltration ratio of immune cells of the MHC-H and MHC-L groups in the ICI-cohort (C) and TCGA-BLCA cohort (D) (E–I) xCell analyses estimate the abundance scores of 64 kinds of immune cells in the MHC-H and MHC-L groups in the ICI-cohort. Dendritic cells (E) include conventional dendritic cells (cDCs), plasmacytoid dendritic cells (pDCs) and immature dendritic cells (iDCs); CD4+T cells (F) include CD4+memory T cells, CD4+naive T cells, CD4+ central memory T cells and CD4+ effector memory T cells; CD8+T cells (G) include CD8+ naive T cells, CD8+ T central memory T cells and CD8+ T effector memory T cells; other types of T cells (H) include T cell gamma delta cells (Tgd), T helper 2 cells (Th2) and regulatory cells (Tregs). Macrophages (I) include M1 macrophages and M2 macrophages. (J) Violin plot showed the distribution of tumor immunophenotype in the MHC-H and MHC-L groups of the ICI-cohort. (K) Heatmap showing the significant difference in the average expression of immune cell-related genes (logFC ≥ 1.5 and P < 0.01) between the MHC-H and MHC-L groups of the ICI-cohort and TCGA-BLCA cohort. Genes which correspond to the same cell type are indicated by the same color. From left to right are the name of the gene, the cell type corresponding to the gene, and the direction of change in gene expression. Red in the right rectangle indicates up-regulation, and blue indicates down-regulation. The logFC value was marked in the right rectangle. (L) Heatmap showing the significant difference in the average expression of immune-related genes between the MHC-H and MHC-L groups in the ICI-cohort and the TCGA-BLCA cohort. Genes of the same category were indicated by the same color. From left to right are the name of the gene, gene function, and the direction of change in gene expression. Red in the right rectangle indicates up-regulation, blue indicates down-regulation, and white indicates that the result was not significant (P > 0.05). The logFC value was marked in the right rectangle. (A−J) *P < 0.05, **P < 0.01, ***P < 0.001, and ****P < 0.0001, ns, not significant.

