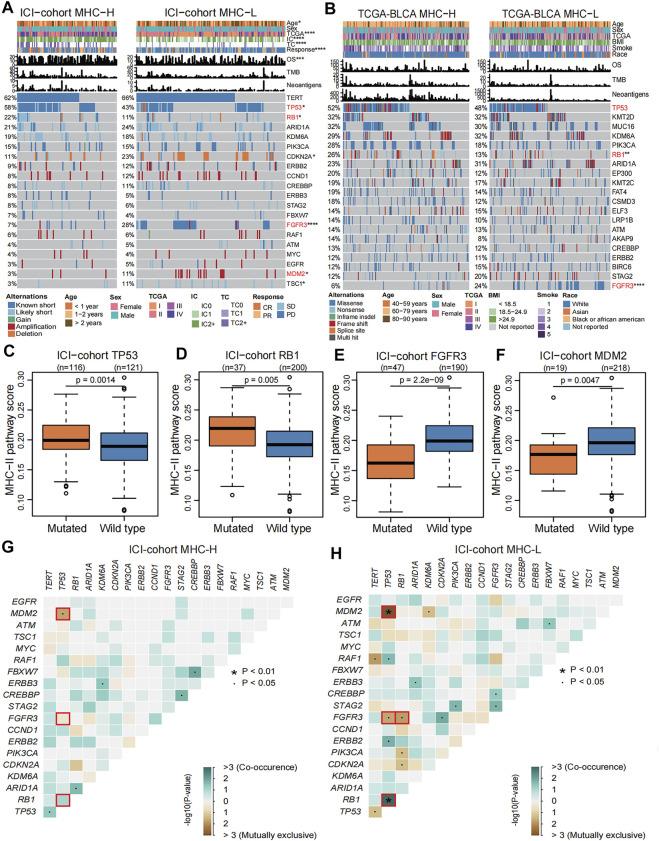
FIGURE 6.
Genomic landscape related to MHC-II signature. (A) Comparison of the differences in the mutation status in the top 20 genes with mutations, diagnosis years (age), sex, TCGA stage, PD-L1 expression (IC level and TC level), immune response, OS, TMB and TNB between MHC-H (left) and MHC-L groups (right) in the ICI-cohort. Genes were ranked by mutation frequency (left panel). The mutation frequencies of TP53, RB1, FGFR3, and MDM2 genes were significantly different between two groups, which are marked with red font. *P < 0.05, **P < 0.01, ***P < 0.001, and ****P < 0.0001. (B) Comparison of the differences in the mutation status in the top 20 genes with mutations, age, sex, TCGA stage, BMI, smoking status, race, OS, TMB and TNB between the MHC-H (left) and MHC-L groups (right) in TCGA-BLCA cohort. Genes were ranked by mutation frequency (left panel). The mutation frequencies of TP53, RB1, and FGFR3 genes were significantly different between two groups, which are marked with red font. *P < 0.05, **P < 0.01, ***P < 0.001, and ****P < 0.0001. C-F. Boxplots show that TP53 (C) and RB1 (D) gene mutations were significantly correlated with high MHC-II signature in the ICI-cohort (Mann Whitney U test, P = 0.0014, P = 0.005, respectively), while FGFR3 (E) and MDM2 (F) gene mutations are significantly correlated with low MHC-II signature in the ICI-cohort (Mann Whitney U test, P = 2.2e-09, P = 0.0047, respectively). G-H. Concurrence (blue) and mutual exclusion (brown) between high frequency mutation genes (the top 20 genes with mutations) in MHC-H (G) and MHC-L (H) groups in the ICI-cohort. ∙P < 0.05, *P < 0.01.

