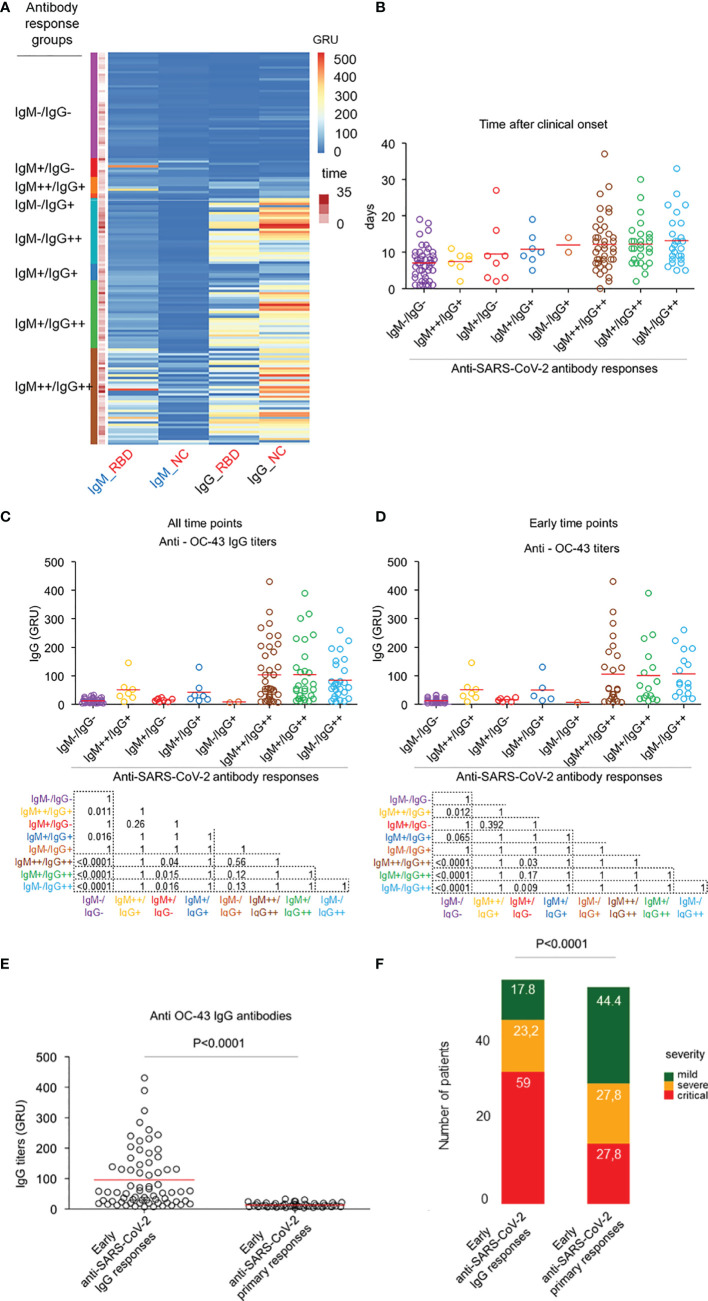
Figure 3.
HCoV-induced cross-reactive anti-SARS-CoV-2 antibodies do not protect against COVID-19. (A) Heatmap representation of the IgG and IgM titres for NC and RBD SARS-CoV-2 coronaviruses; colors refer to z-score values. Patients were labelled according to their corresponding IgG/IgM subgroup. (B) Dot plot representation of the temporal distribution of the 8 identified subgroups of patients; mean time levels are represented in red circles. Dot red line is set at day 12. Sera drawn before or at day 12 are defined as early, while those drawn after are defined as late. (C) Dot plot representation of the anti-HCoV-OC-43 IgG antibody responses across all the IgG/IgM subgroups, which are colour-coded. Mean comparison was computed using the Wilcoxon test. (D) Dot plot representation of the anti-HCoV-OC-43 (right) IgG antibody across all the IgG/IgM subgroups which are colour-coded with the time points selected within 12 days after clinical onset. Mean comparison using Wilcoxon test was computed between IgM++/IgG++ and IgM+/IgG-. (E) Dot plot representation of the anti-HCoV-OC-43 IgG responses by early (sera drawn with 12 days after clinical onset) anti-SARS-CoV-2 IgG and early primary response groups. Mean comparison using nonparametric Mann-Whitney U test was performed. (F) Bar plot representation of the distribution of severity patients across the early IgG responses (n=56) and early primary (n=54) subgroups. All sera were drawn within 12 days after first symptoms. Frequencies of mild, severe and critical cases in each subgroup are indicated in each bar plot. Comparison of the proportions of severity subgroups between the early IgG response and early primary subgroups was made using the Chi-square test.

