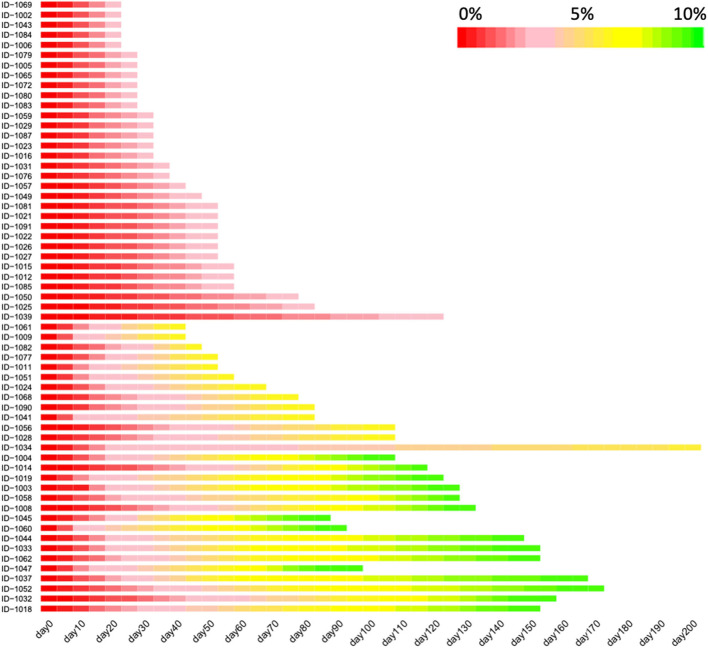
Figure 2.
The velocity of body weight reduction over the course of low-carbohydrate diet program. Heatmap depicting the values of the percentage of lost body weight, with red color indicating the baseline body weight while yellow and green indicating that the percentage reach 5 and 10%, respectively. Only the participants achieving a weight loss of at least 5% were included in this figure (n = 61). This figure was trimmed at 150 days due to the space limits.

