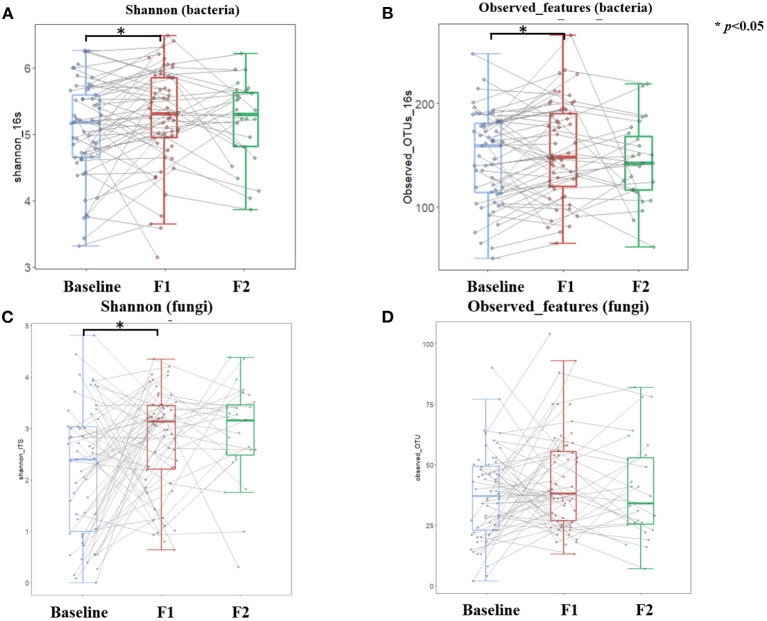
Figure 6.
Dynamics of gut microbial diversity over the course of low-carbohydrate diet-induced weight loss. Boxplot depicting Shannon and Observed features of both gut bacteria (A,B) and gut fungi (C,D) at different timepoints corresponding to baseline (light blue color), 5% weight loss (red color), and 10% weight loss (green color), respectively. Lines between boxplots link body composition values of the same participant at different timepoints. Paired T-test was conducted to examine difference between sequential visits, with *p < 0.05 indicating statistical significance.

