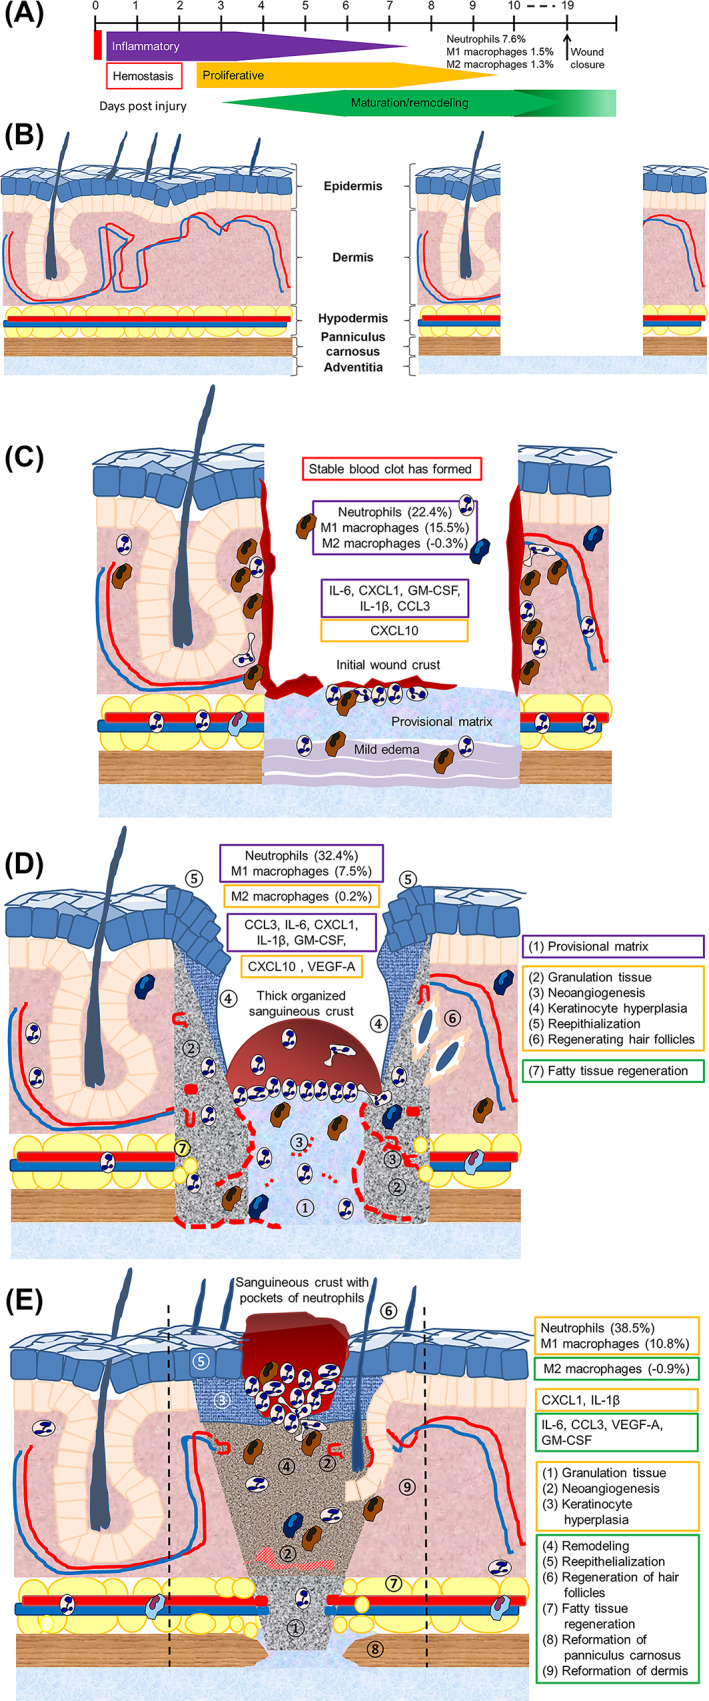
FIGURE 10.

Model summarising the effect of BDWG on wound healing. A, Revised timeline showing the continuum of healing observed in the BT wounds. B, Diagram of normal skin and the excision wound imposed on normal skin. Progression of healing from 1 dPIT (C) to 3 dPIT (D) to 7 dPIT (E) showing key findings at each stage of healing. Boxes in C, D are colour‐coded to match the stages of healing shown in A (red, haemostasis; purple, inflammatory; orange, proliferative; green, remodelling). Features of each stage of healing are indicated by numbered circles on diagrams D and E. Dashed lines on panel E indicate the original margins of the wound. BDWG, biofilm‐dispersing wound gel; BT, BDWG‐treated
