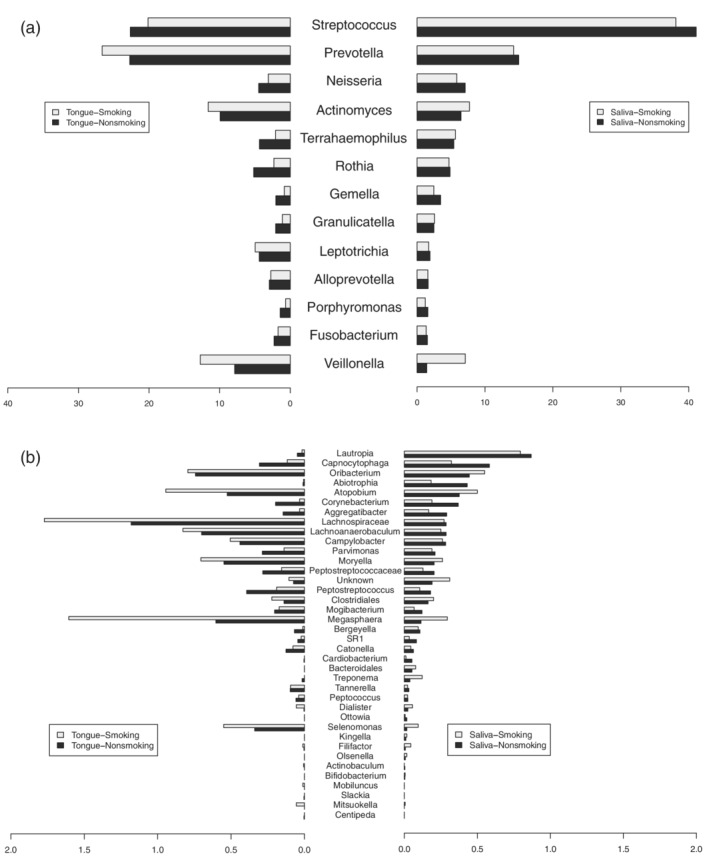
Figure 2.

Comparison of the proportion of bacterial genera between smokers and nonsmokers. Genera with high proportions (a) and genera with low proportions (b). The left side is the tongue microbiome and the right side is the saliva microbiome. Light‐gray bars show the proportions of genera in smokers, and black bars show the proportions of genera in nonsmokers
