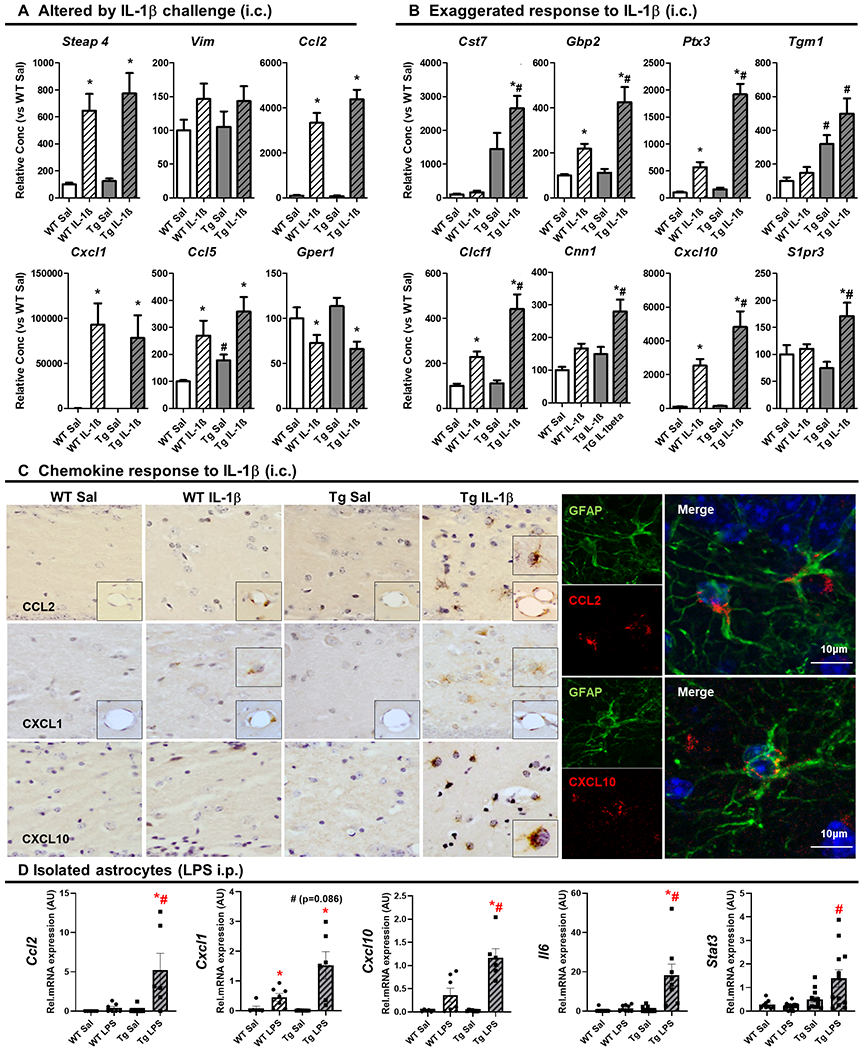
Figure 5. Astrocytes are primed to show exaggerated chemokine production in APP/PS1.

(A) Transcriptional changes induced by intracerebral (i.c.) IL-1β challenge (10ng) in hippocampal mRNA levels of selected astrocyte-associated genes, 2 h after challenge, expressed as fold change with respect to WT+Sal. Aged 19±3months. Mean ±SEM (n=8-10). (B) Exaggerated response to IL-1β challenge (10ng, i.c.) in hippocampal mRNA levels of selected astrocyte-associated genes, 2 h after challenge, expressed as fold change with respect to WT+Sal. Aged 19±3months. Mean ±SEM (n=8-10). (C) Chemokine response to IL-1β challenge (10ng, i.c.) Light microscopy labelling of CCL2, CXCL1 and CXCL10 in WT and Tg mice, 2 h after i.c. challenge with IL-1β (10 ng) or saline. Right panel shows the confocal imaging of Tg+IL-1β group for CCL2 (red; 594nm) and GFAP (green; 488nm) on the left and CXCL10 (red; 594nm) and GFAP (green; 488nm) on the right. (D) Transcriptional changes in isolated astrocytes of the selected chemokines together with Il6 and Stat3, Ccl2, Cxcl1 and Cxcl10, using a systemic inflammation model (3 h after LPS (250μg/kg, intraperitoneal, i.p.)). Aged 14±2months. Mean ±SEM (n=6-13). Kruskal Wallis Test followed by Mann-Whitney test, * effect of treatment; # effect of genotype (p < 0.05).
