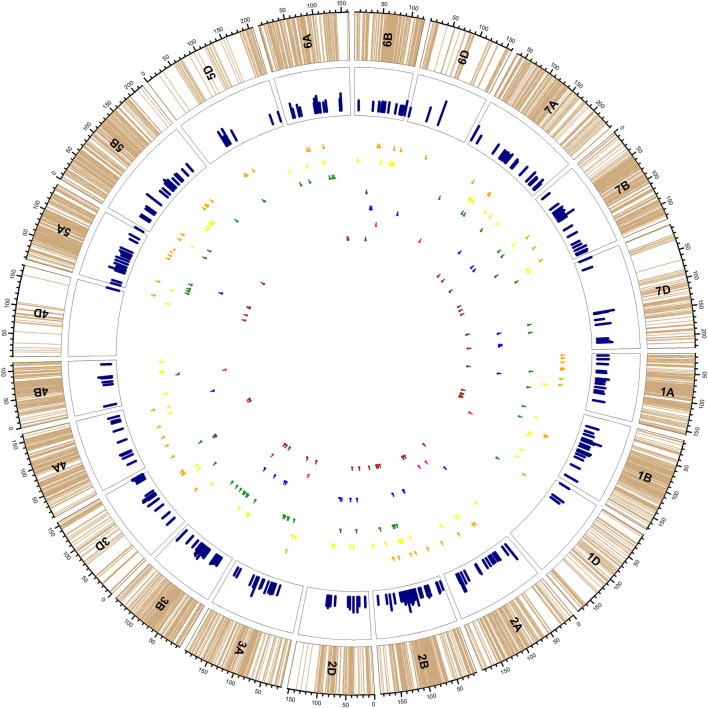
FIGURE 3.
Distribution of 246 QTLs [yellow (yellow wheat blossom midge), orange (orange wheat blossom midge), green (yellow/orange wheat blossom midge), black (saddle gall midge), blue (thrip), pink (frit fly) and maroon (mixed pests)] in the inner circles. Light brown lines in the outer track indicate the SNP positions on each chromosome; pink bars in the second circle indicate the maximum R2 provided by any SNP confided to that QTL. The corresponding lines under the track circle indicate the span of QTLs for respective traits with small vertical lines point to the peak position of QTL.

