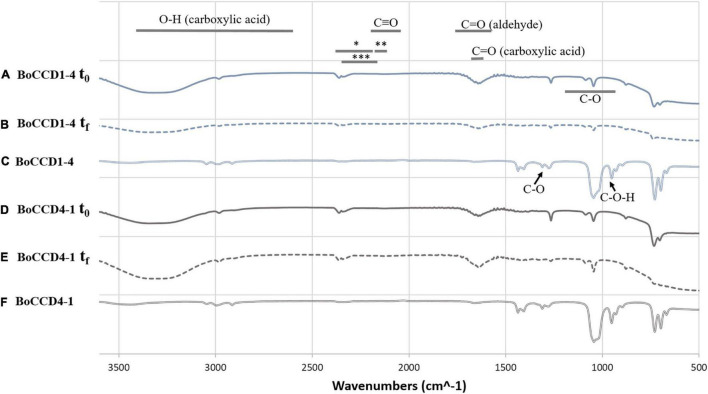
FIGURE 5.
FTIR spectrum of the in vitro and in vivo extracts of BoCCD1-4 and BoCCD4-1. FTIR spectrum of the initial time (t0) of the in vitro enzymatic reaction of (A) BoCCD1-4 and (D) BoCCD4-1. FTIR spectrum of the end time (tf) of the in vitro enzymatic reaction of (B) BoCCD1-4 and (E) BoCCD4-1. FTIR spectrum of the in vivo assay of (C) BoCCD1-4 and (F) BoCCD4-1.

