Figure 4.
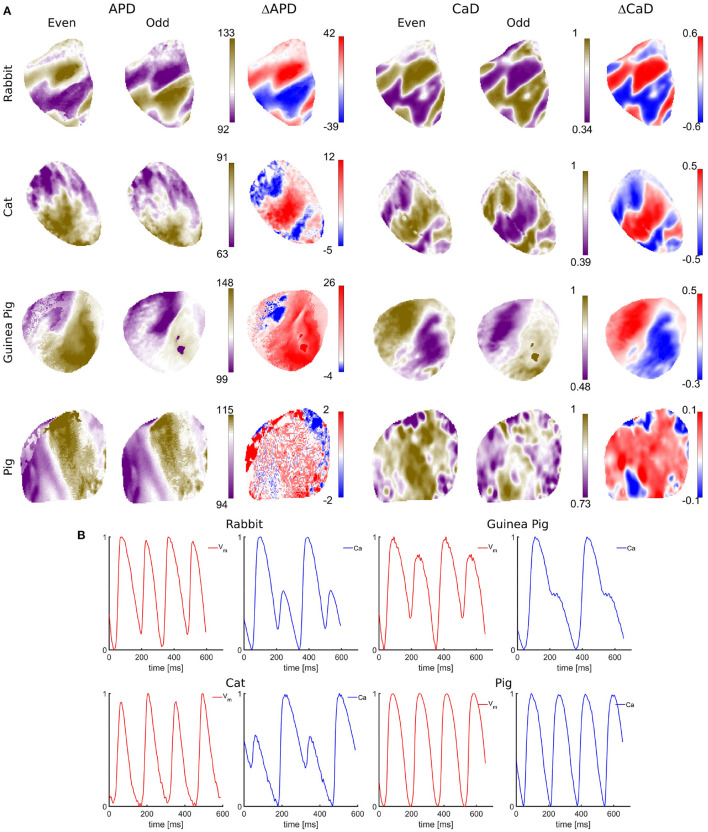
Single-camera dual Vm−Ca measurements in isolated hearts of different species. (A) Arrhythmic effects under dynamic pacing, shown as spatial dispersion of APD and CaD across tissue for different species for even and odd beats. The spatial dispersion indicates an increased susceptibility to arrhythmia. APD values are obtained from 50% signal rise in amplitude till 50% AP repolarization. Numbers to the right indicate 3rd and 97th percentile APD values expressed in milliseconds. CaD values are obtained as the integral from 50% rise in amplitude till 50% decrease. Blue-red patterns show variations in APD and CaD (ΔAPD, ΔCaD) between even and odd beats (discordant alternans), showing regions alternating out of phase and separated with the nodal lines (white lines). Spatially discordant alternans are the counterpart of T-wave ECG alternans, a well-known marker for arrhythmia susceptibility. Although all species do develop arrhythmia under dynamic pacing, the electrophysiology across species is very different. Spatially discordant alternans are the most pronounced in rabbits, while pig hearts show very little APD and CaD dispersion, with insignificant differences between even and odd beats. (B) Vm and Ca representative AP signals showing temporal alternans for different species.

