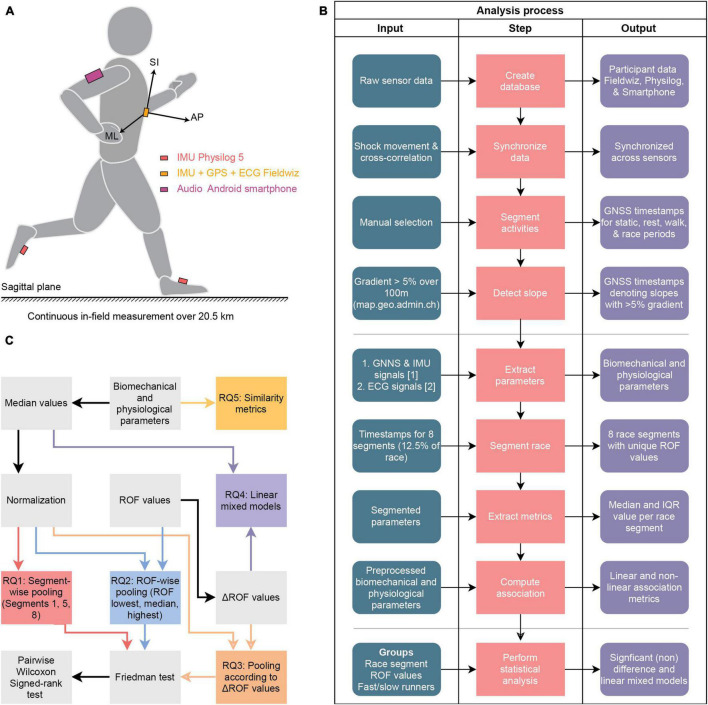
FIGURE 1.
Sensor setup and data analysis process, (A) sensor configuration used for the measurement, where AP, SI, and ML denote the anterior-posterior, the superior-inferior, and the medio-lateral axis (B) flowchart for the overall procedure, showing three blocks for the pre-processing, feature extraction, and statistical analysis (C) statistical analysis procedure where the biomechanical and physiological parameters generated in (B) and the recorded ROF values are used as inputs. ROF, Rating-of fatigue; ECG, electrocardiogram; IMU, inertial measurement unit; GNSS, global navigation satellite system; IQR, interquartile range; RQ, research question.

