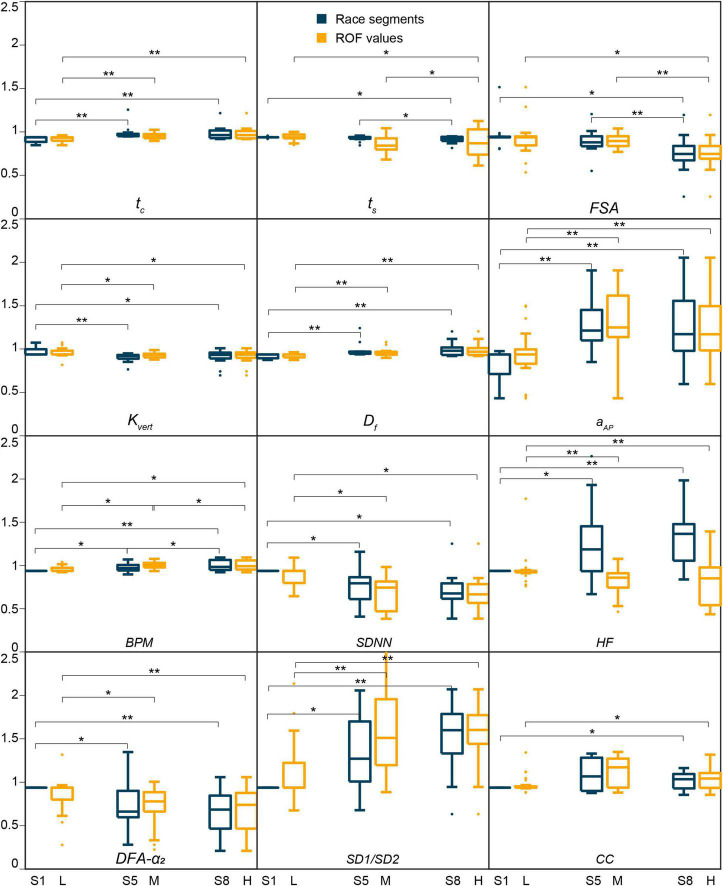
FIGURE 2.
Parameters with a significant change with the race segments (in blue) and/or rating of fatigue (in yellow), with *p ∈ (0.01, 0.05) and **p ∈ (0.001, 0.01). S1, S5, and S8 represent the race segments 1, 5, and 8, and L, M, and H the low, medium, and high ROF values. Except aAP, all biomechanical parameters show substantially lower variability in trends than the physiological parameters.

