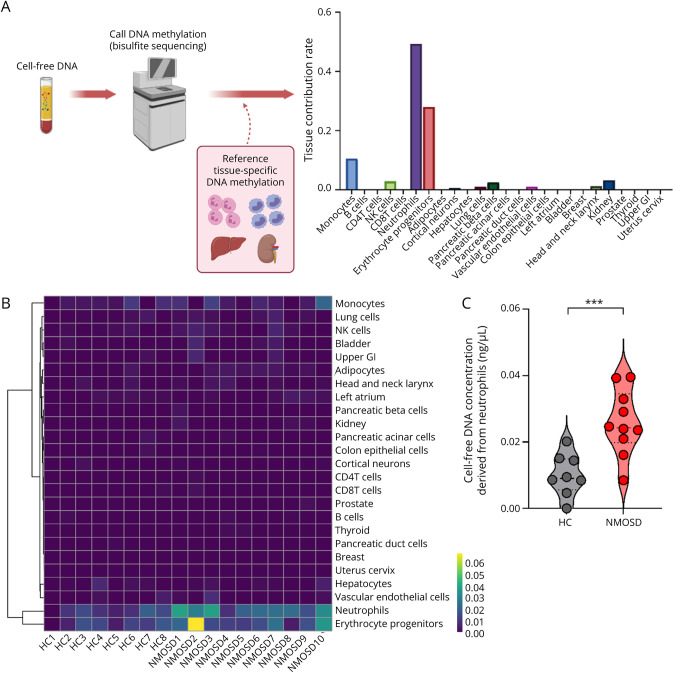
Figure 2. Concentration of Neutrophil-Derived cfDNA Is Elevated in Patients With NMOSD.
(A) Schematic representation of the calculation of tissue contribution based on tissue-specific methylation profiles. (B) Heat map visualization of cfDNA concentration from different sources. (C) cfDNA concentration derived from the neutrophils in NMOSD plasma (n = 10) or healthy control plasma (n = 8). The Mann-Whitney U test was used to determine statistical significance. ***p < 0.002. HC = healthy control.

