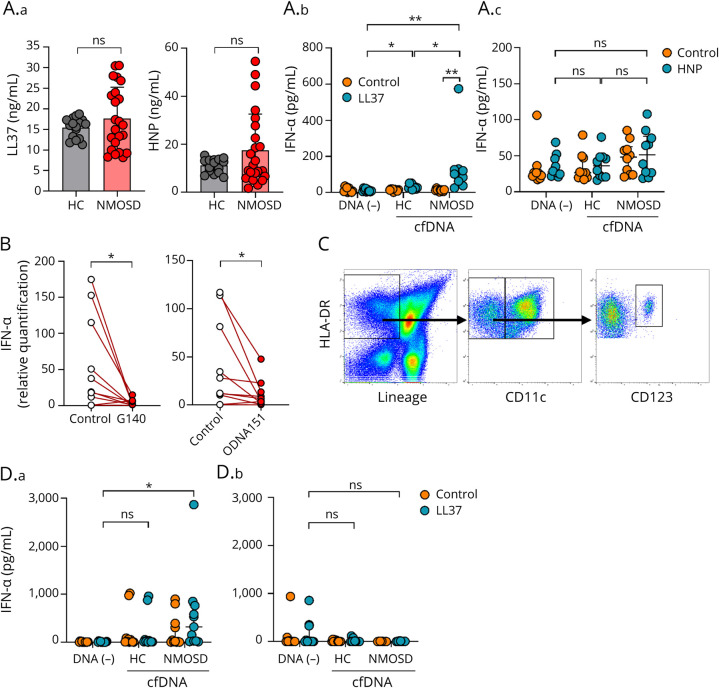
Figure 3. cfDNA Derived From Patients With NMOSD Induces the Production of IFN-α in the Presence of LL37.
(A.a) LL37 (ng/mL) and HNP (ng/mL) in NMOSD sera (n = 23) or healthy control sera (n = 16). The Mann-Whitney U test was used to determine statistical significance. (A.b) (A.c) IFN-α (pg/mL) in culture media. After stimulation of PBMCs with cfDNA extracted from NMOSD sera (n = 10) or healthy control sera (n = 10) in the presence or absence of LL37 (10 μM) (A.b) or HNP (10 μM) (A.c), culture media were collected and assayed by ELISA. The Kruskal-Wallis H-test (Bonferroni adjusted) was used to determine statistical significance. (B) The expression of IFN-α of healthy control PBMCs stimulated by NMOSD sera incubated with cGAS inhibitor (G140) or TLR9 antagonist (ODN A151) (n = 10). The Wilcoxon signed-rank test was used to determine statistical significance. (C) Gating strategy for cell sorting. HLA-DR (+) Lineage (−) CD11c (−) CD123 (+) was defined as pDCs. HLA-DR (+) Lineage (−) CD11c (+) was defined as cDCs. (D) IFN-α (pg/mL) in culture media. After treatment of pDCs (D.a) or cDCs (D.b) with cfDNA extracted from NMOSD sera (n = 11) or healthy control sera (n = 11) in the presence of LL37 (10 μM), culture media were collected and assayed by ELISA. The Kruskal-Wallis H-test (Bonferroni adjusted) was used to determine statistical significance. *p < 0.05, **p < 0.005. HC = healthy control; ns = not significant.

