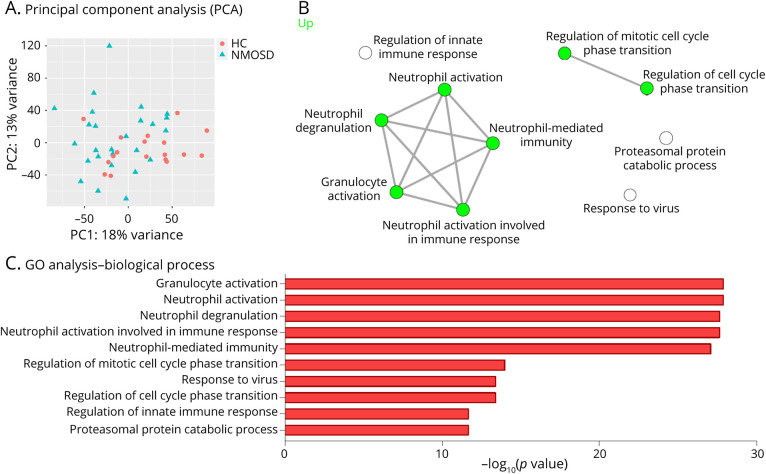
Figure 4. Whole Blood Transcriptome Reveals Neutrophil Activation in Patients With NMOSD.
(A) Principal component analysis indicating transcriptional clustering in whole blood of healthy control subjects (n = 18) and patients with AQP4 antibody–positive NMOSD (n = 26). (B) Visualization of networks between the gene ontology (GO) biological process in AQP4 antibody–positive NMOSD whole blood RNA-seq. GO analysis based on GAGE was performed in healthy controls (n = 18) and patients with AQP4 antibody–positive NMOSD (n = 26). (C) The top 10 GO terms associated with biological process in AQP4 antibody–positive NMOSD whole blood RNA-seq. HC = healthy control.

