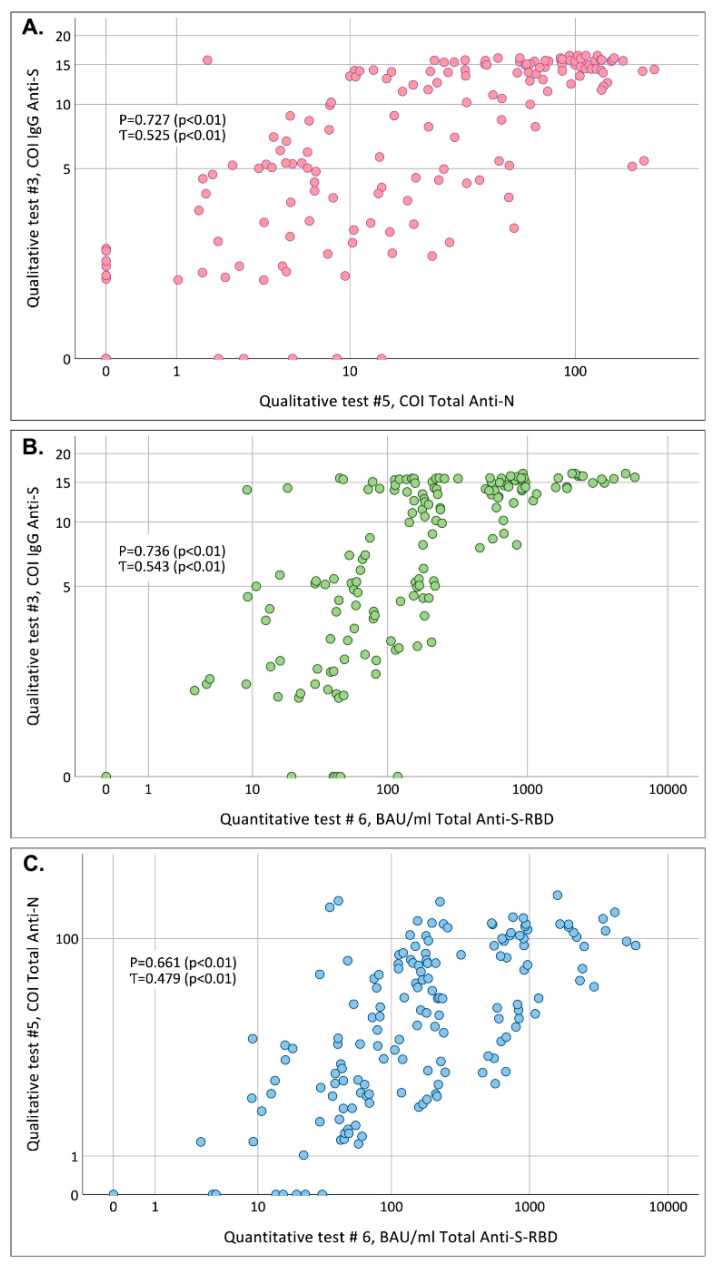
Figure 3.
Scatter plots characterizing the correlation between (A) COIs obtained in test #3 (anti-S IgG) and test #5 (anti-N total antibodies), pink dots; (B) between COIs obtained in test #3 (anti-S IgG) and anti-SARS-CoV-2 concentrations measured in test #6 (total anti-S), green dots; (C) between COIs obtained in test #5 (total anti-N) and anti-SARS-CoV-2 concentrations measured in test #6 (total anti-S), blue dots; tested in the same panel of samples (n = 160). P: Spearman coefficient; Ƭ: Kendall coefficient. Note: when plotting the graphs, samples with negative results and in the gray zone were taken as “0”. COI, cut-off index. BAU/mL, binding antibody units per mL. N, nucleocapsid protein. S, spike protein. RBD, receptor binding domain.

