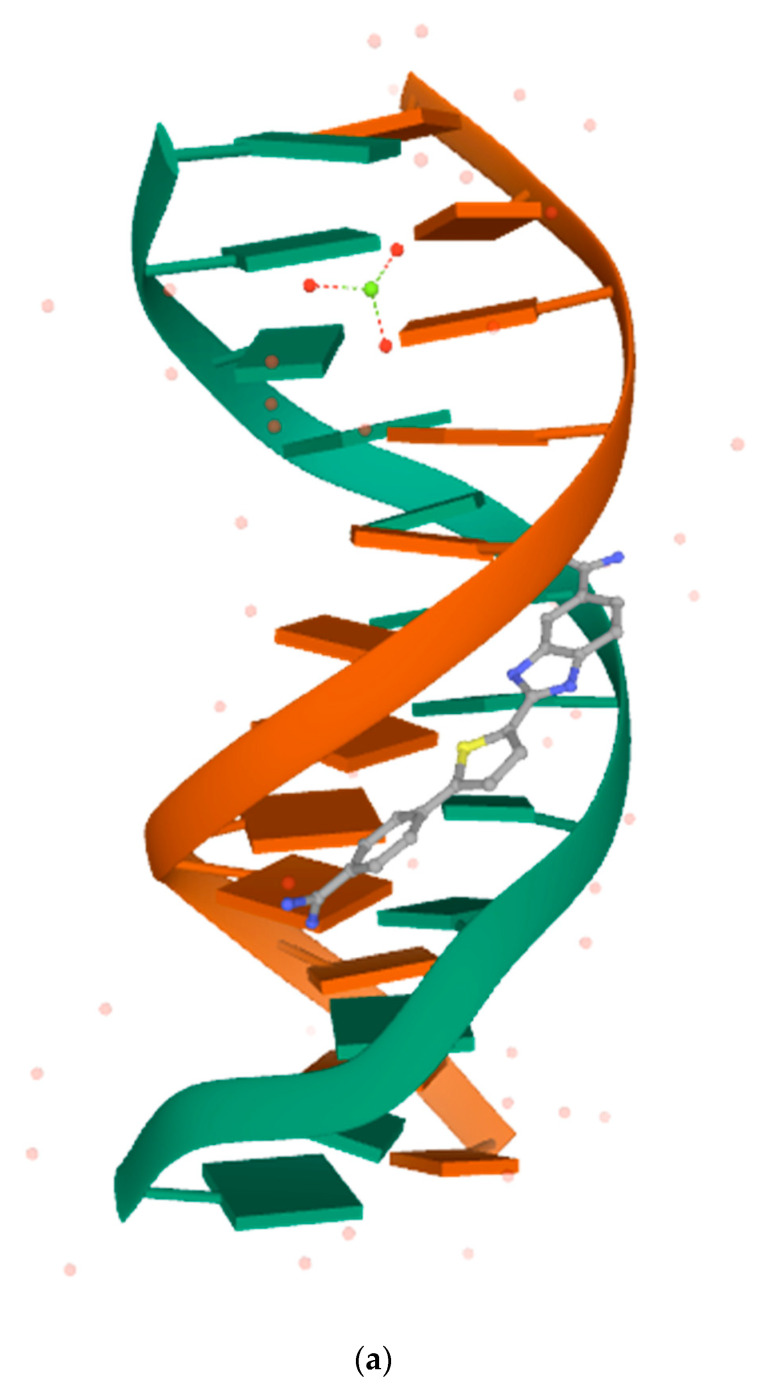
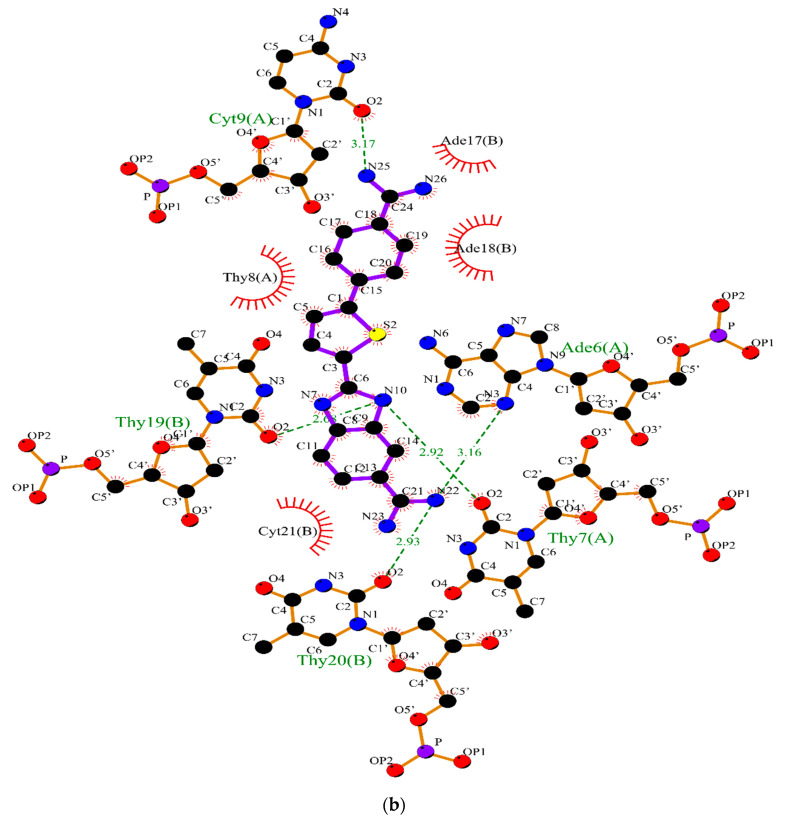
Figure 1.
(a) The crystallographic structure of molecular target under PDB code 1VZK; (b) a close view of the intermolecular interactions between ligand (D1B) in the minor DNA groove of the 1VZK. The red circles and ellipses in each plot indicate protein residues. Hydrogen bonds are shown as green dotted lines, while the spoked arcs represent residues making van der Waals interactions with the ligand generated with LigPlot+.


