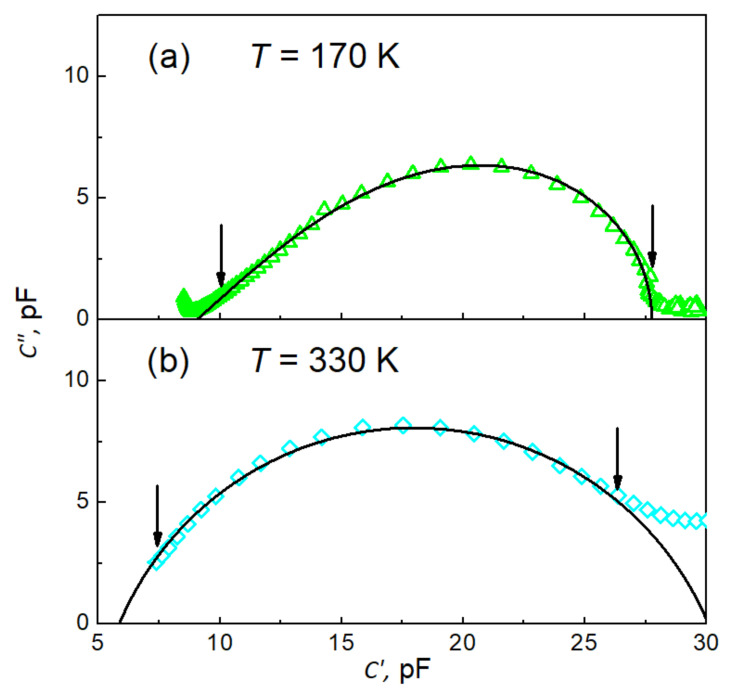
Figure 7.
Cole–Cole-type plots vs. of experimental data (open symbols) and their best fits (black solid lines) (a) to Equation (5) with C∞ = 90.52(89) pF, ΔC = 18.69(10) pF, τCD = 25.84(56) ms, and β = 0.4674(74) and (b) to Equation (6) with C∞ = 5.86(28) pF, ΔC = 24.22(43) pF, τCC = 2.83(40) ms, and ¦α = 0.7449(26). The vertical arrows indicate the range of data used for the fits.

