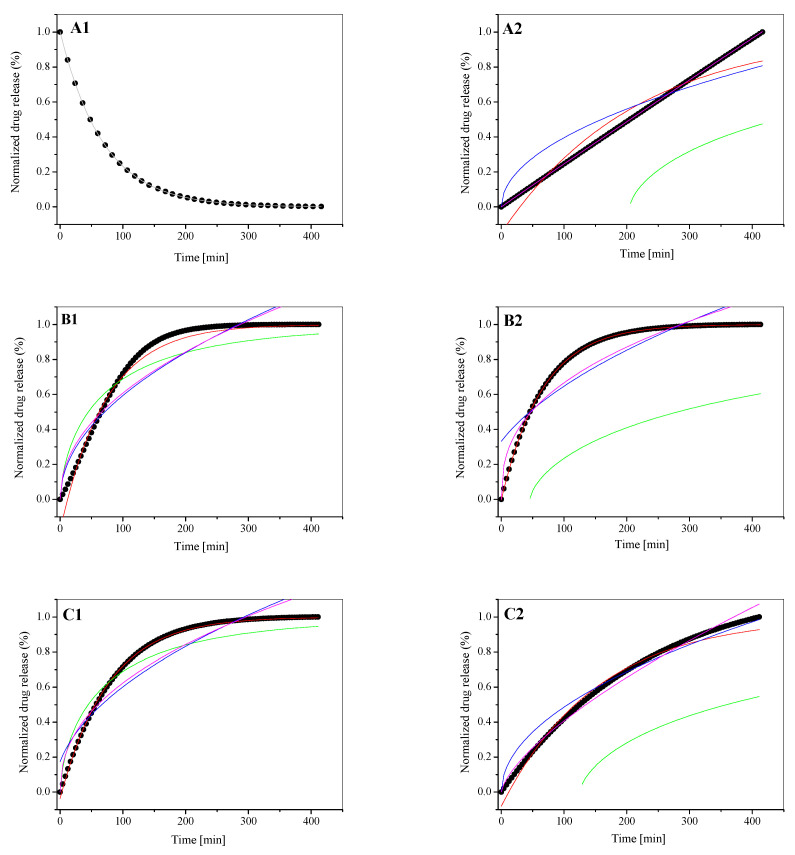
Figure 7.
The release kinetics of 5-MBT from the LDPPC/5-MBT liposomes (A1–C1) and their complexes with HSA [LDPPC/5-MBT]:HSA (A2–C2). (A) pH 4.47, (B) pH 5.59, (C) pH 6.10. Colored lines corresponding to the fits of the mathematical models. Black dot lines corresponding to the experimental data. (-) Korsmeyer–Peppas model; (-) first-order model; (-) Bhaskas model; (-) Higuchi model; (-) Ritger–Peppas model.

