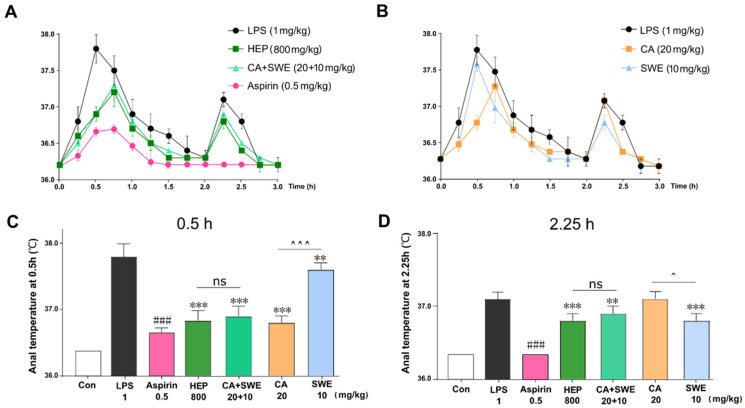
Figure 3.
(A,B) Anal temperature curve of Aspirin, HEP, CA+SWE (left panel) and CA, SWE (right panel) in the first 3 h after intraperitoneal injection of LPS. Values are given as means ± standard deviation (SD) (n = 10). (C,D) Anal temperature at 0.5 h and 2.25 h for each group. ### p < 0.001, Aspirin vs. LPS; ** p < 0.01, *** p < 0.001, drug intervention group vs. LPS; ^ p < 0.05, ^^^ p < 0.001, CA vs. SWE; ns, not significant (n = 10).

