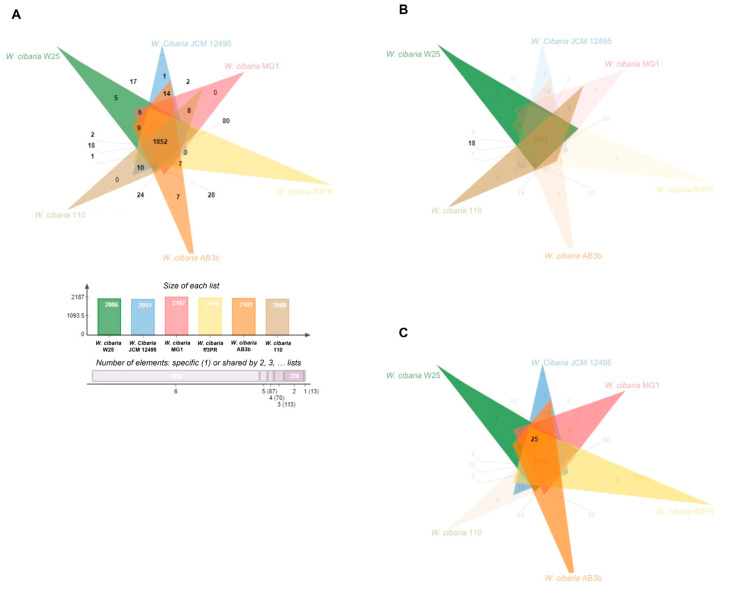
Figure 3.
Venn diagrams showing the protein coding genes or pseudogenes of six W. cibaria strains. Overlapped regions represent shared proteins and the numbers in the non-overlapped regions indicate the unique protein coding genes or pseudogenes. (A) normal Venn diagram; (B) Venn diagram highlighting the cluster between W. cibaria W25 and W. cibaria 110; (C) Venn diagram highlighting the clusters between W. cibaria W25 and the non-bacteriocin-producing strains.

