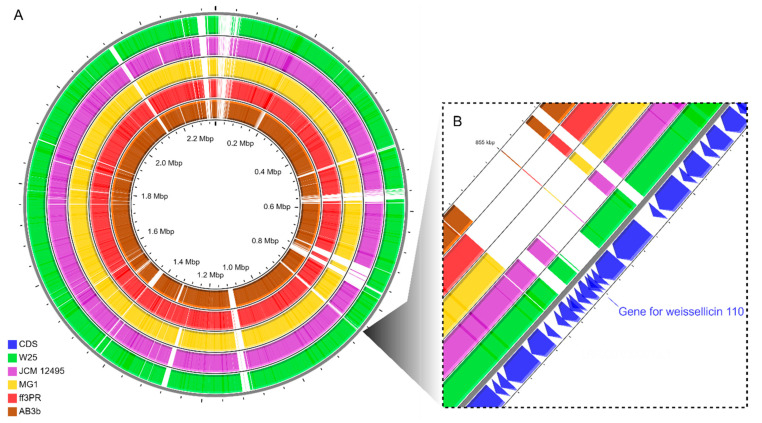
Figure 4.
Comparative genome map generated using CGView server, showing a full circular map obtained using BLAST (A) and an expanded view of the weissellicin 110 region (B). The rings in (A) and (B) in green, purple, yellow, red and brown indicate the W. cibaria strains W25, JCM 12495, MG1, ff3PR and AB3b, respectively, that were compared with the W. cibaria 110. The blue ring in (B) indicates the coding sequences (CDS) of the genome from W. cibaria 110.

