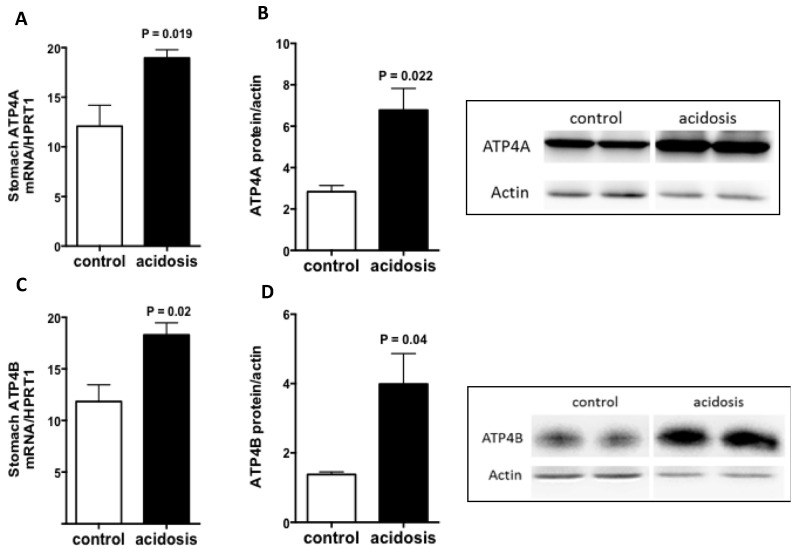
Figure 1.
Regulation of ATP4A and ATP4B expression by acidosis in the stomach. (A,C): quantification of the mRNA levels of ATP4A and ATP4B in the stomachs of control and acidosis mice, respectively. (B,D): left panel: Representative western blot images of ATP4A and ATP4B proteins, and right panel is the quantification of the ratio of ATP4A on actin signals, respectively. Data are mean ± sem, n varies between 3 and 4 mice for each group.

