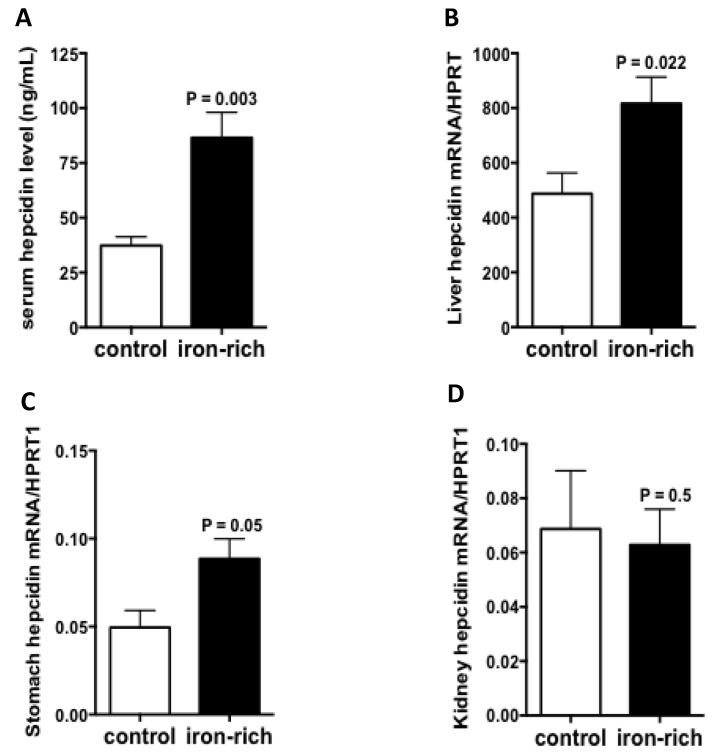
Figure 6.
Regulation of gastric and renal hepcidin by iron. (A): Serum hepcidin levels measured by LC-MS/MS in control and iron-rich feeding mice. (B–D): Hepcidin mRNA quantification in the liver, stomach and kidneys of control and iron-rich feeding mice, respectively. Data are mean ± sem, normalized by the housekeeping gene Hprt1. Data are explored in n = 7 mice for each group.

