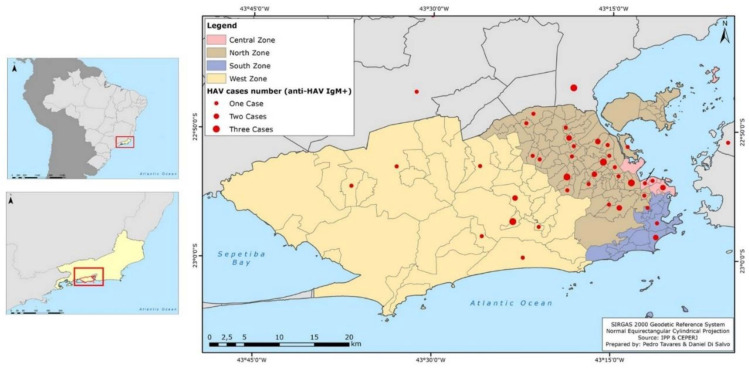
Figure 3.
Distribution map of HAV cases (anti-IgM reagent) according to city/neighborhood/geographical zone of residence of patients attended at the clinic. Geographical zones are colored; North zone (brown); Central zone (light pink); South zone (blue); West zone (yellow), and neighboring cities (grey). The red dots (●) represent cases in each zone/neighborhood: small red dots represent one case, medium red dots two cases, and big red dots three cases. All information can be seen in the legend on the top left.

