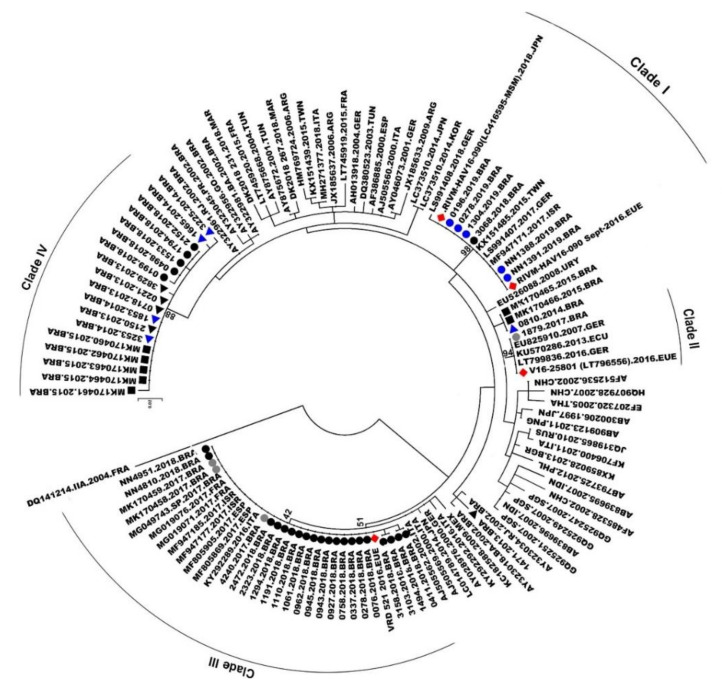
Figure 4.
Phylogenetic tree generated using the Maximum Likelihood method with 3000-replicate bootstrap resampling, with 65 VP1-2A region reference sequences from genotype IA isolates from the GenBank. The number in the tree represents bootstraps. The viral European and Asian outbreak strains are marked with red rhombus (♦). The study sequences are marked with: 2013, black triangle (▲); 2014, blue triangle (▲); 2018, black dot (●); and 2019, blue dot (●). All study sequences are available on the GenBank; access numbers are available in Table S2. Sequences from 2015, black square (■), all previously published [15]; 2017, grey dot (●), two sequences published previously [15].

