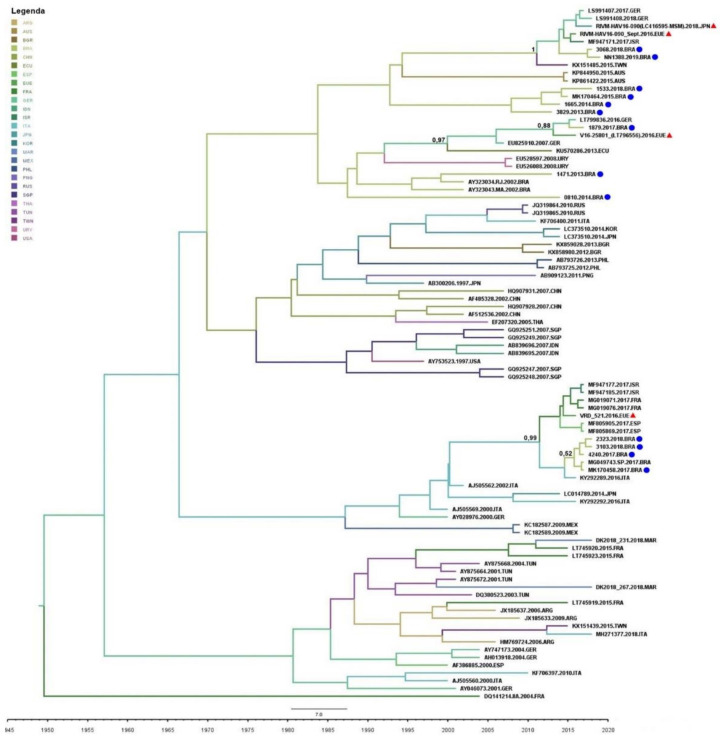
Figure 6.
Time-scaled Bayesian MCMC tree of the hepatitis A virus from different countries between the years 1995 and 2020. The European/Asian-related viral strains are marked with a red triangle (▲). The study sequences are marked with a blue dot (●). Branches are colored according to the most probable location of their descendent nodes. The color code is indicated in the upper left legend: ARG = Argentina; AUS = Australia; BGR = Bulgaria; BRA = Brazil; CHN = China; ECU = Ecuador; ESP = Spain; USA = European Union; FRA = France; GER = Germany; IDN = India; ISR = Israel; ITA = Italy; JPN = Japan; KOR = South Korea; MAR = Morocco; MEX = Mexico; PHL = Philippines; PNG = Papua New Guinea; RUS = Russia; SGP = Singapore; THA = Thailand; TUN = Tunisia; TWN = Taiwan; URY = Uruguay; USA = United States of America. Number in the tree represented the pp.

