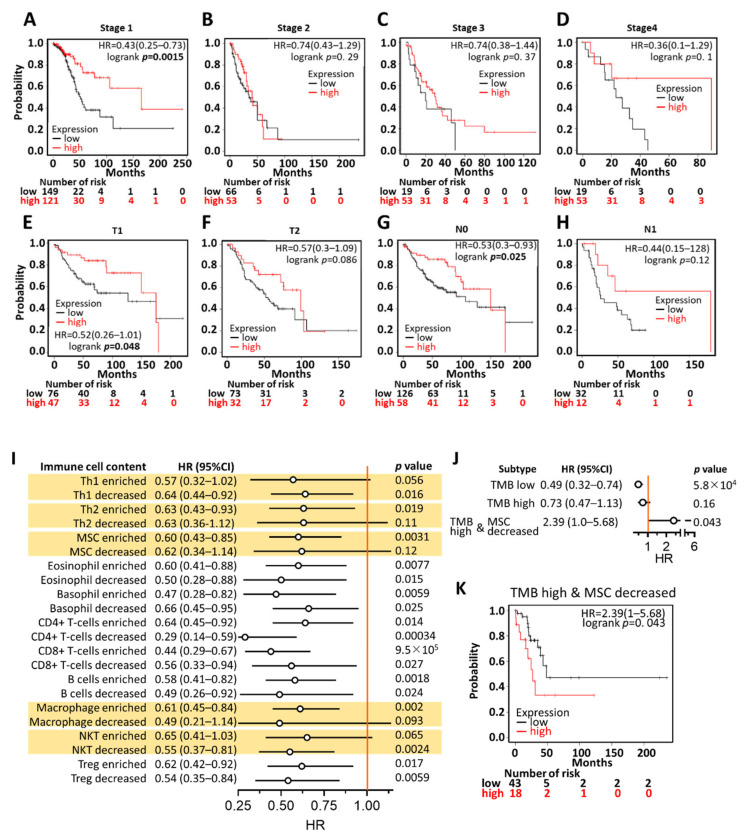
Figure 4.
Prognostic value of KCNQ1 in LUAD patients. Kaplan–Meier survival analysis representing the probability of overall survival based on low/high expression of KCNQ1 in the scenario of stage 1 (A), stage 2 (B), stage 3 (C), stage 4 (D), AJCC stage T1 (E), AJCC stage T2 (F), AJCC stage N0 (G), and AJCC stage N1 (H). A forest plot summarizing the hazard ratio (HR), the 95% confidence interval (95% CI), and the logrank p-value of LUAD KCNQ1 expression in the context of various immune cell contents (I), of high/low tumor mutation burden (TMB), or of high TMB combined with decreased MSC (J). Kaplan–Meier analysis based on low/high KCNQ1 expression in the presence of high TMB and decreased MSC (K).

