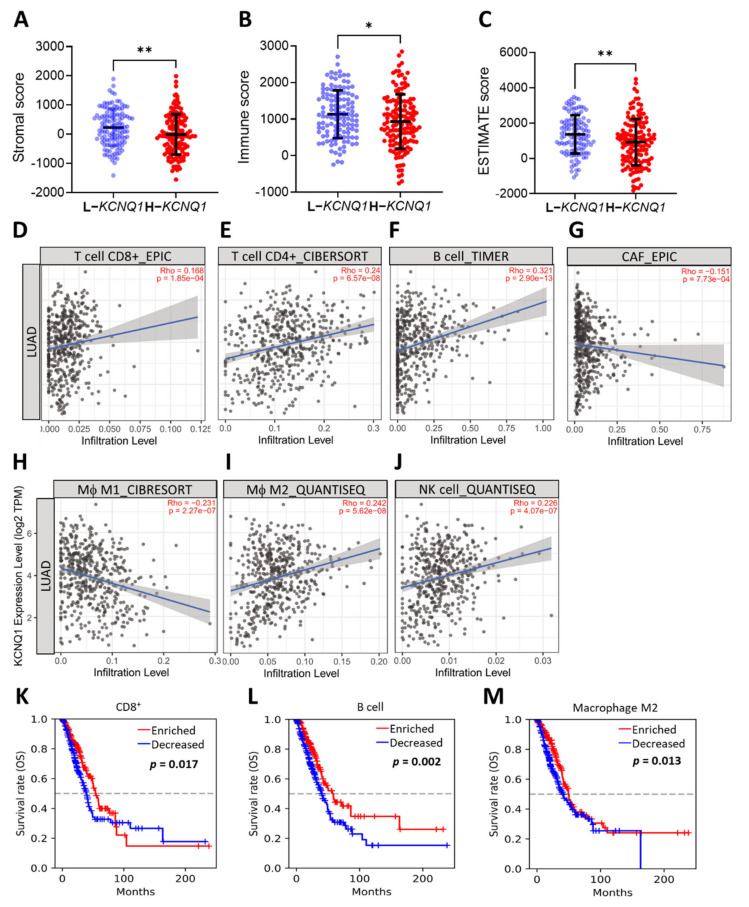
Figure 5.
KCNQ1 is closely related to immune infiltration. ESTIMATE analysis of stromal score (A), immune score (B), and ESTIMATE score (C). * p < 0.05, ** p < 0.01 between indicated groups. TIMER analysis of Spearman correlation between the KCNQ1 expression and the infiltration of CD8+ T cells (D), CD4+ T cells (E), B cells (F), cancer associated fibroblasts (CAF) (G), (Mϕ) M1 macrophages (H), (Mϕ) M2 macrophages (I), natural killer (NK) cells (J). Kaplan–Meier analysis based on enriched/decreased content of CD8+ T cells (K), B cells (L), and M2 macrophages (M) in the LUAD cohort.

