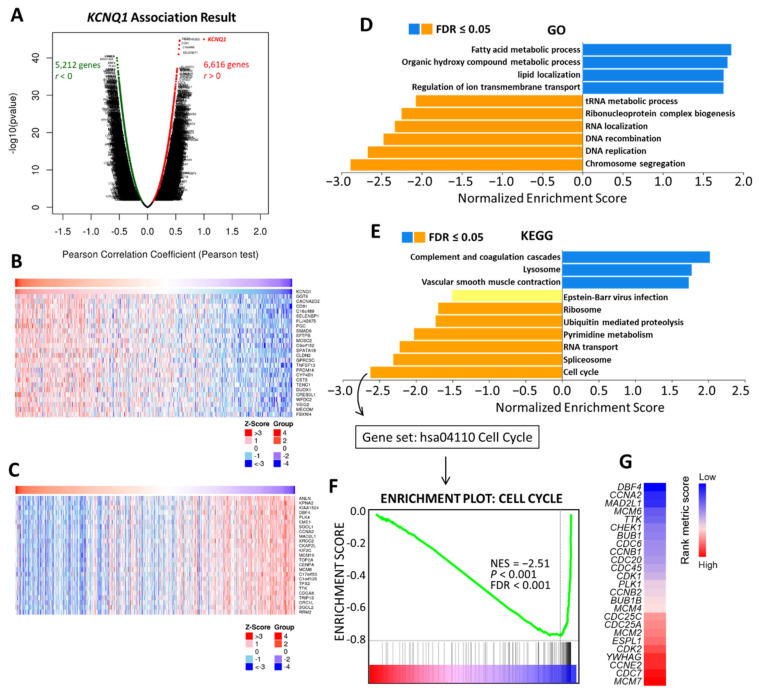
Figure 7.
Co-expression genes of KCNQ1 and analysis of functional enrichment. Genes significantly correlated with KCNQ1 identified by Pearson correlation analysis in the LUAD cohort (A). Heatmaps illustrating the top 25 genes positively (B) and negatively correlated with KCNQ1 in LUAD cohort (C). GO process term (D) and KEGG pathways (E) significantly enriched in KCNQ1-coexpressed genes in the LUAD cohort. Enrichment plots of the cell cycle functional gene set. NES, normalized enrichment score; FDR, false discovery rate (F). Heatmap showing the rank metric score of core enrichment genes for the gene class of the cell cycle (G). The genes then underwent Kaplan–Meier analysis to confirm the clinical relevance.

