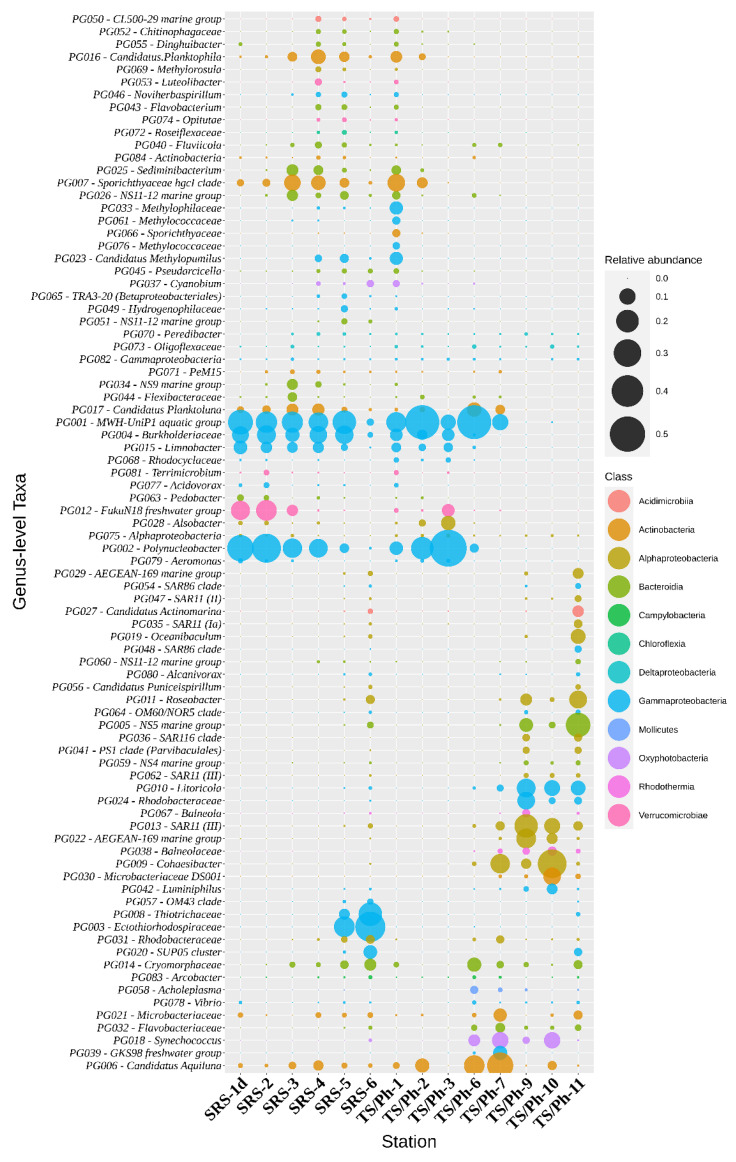
Figure 4.
Relative abundance of the bacterial tax comprising more than 0.1% of the bacterial sequences in each sample. Taxa are classified to genera (prokaryotic genera, PG, QIIME2 classifier level 6) or the lowest rank possible according to the classifier. The size of the bubbles represents their relative abundance, and the color indicates the class.

