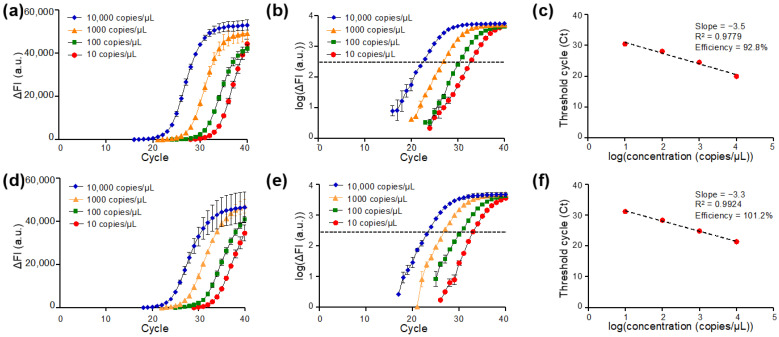
Figure 4.
qPCR of the SARS-CoV-2 N gene with U.S. Centers for Disease Control and Prevention (CDC)-referenced N1 or N2 primer-probe set with 1.5 μL droplets on the DMF cartridge: (a–c) N gene detected by N1 primer-probe set and (d–f) by N2 primer-probe set. qPCR amplification curves of delta fluorescence intensity (ΔFI) against cycle number for various template concentrations detected by (a) N1 and (d) N2 primer-probe sets. Logarithmic plots of ΔFI against cycle number for various concentrations of reactions carried out by (b) N1 and (e) N2 primer-probe sets. Standard curve and qPCR efficiency of (c) N1 and (f) N2 primer-probe sets targeting to SARS-CoV-2 N genes on the DMF cartridge (n = 4 for each concentration).

