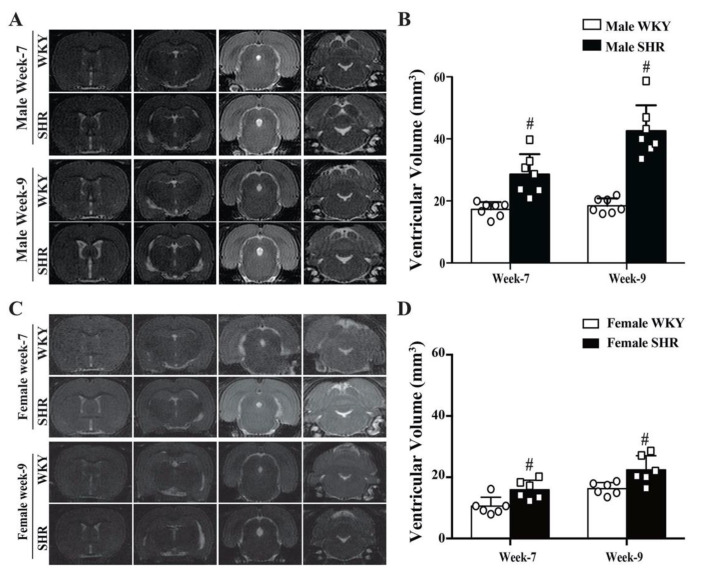
Figure 1.
(A) T2-weighted MRI images showing ventricular enlargement in male SHRs compared to age-matched WKYs at weeks 7 and 9. (B) Quantification of the ventricular volume of male SHRs and WKYs. Values are the means ± SD, n = 7; # p < 0.01 compared with the male WKY group. (C) T2-weighted MRI images showing the ventricular volume in female SHRs and age-matched WKYs at weeks 7 and 9. (D) Quantification of the ventricular volume of female SHRs and WKYs. Values are the means ± SD, n = 6; # p < 0.01 compared with the female WKY group.

